Machine Generated Data
Tags
Color Analysis
Feature analysis
Amazon
| Rug | 71.8% | |
Categories
Imagga
| text visuals | 57.4% | |
| interior objects | 40.3% | |
| streetview architecture | 1.4% | |
Captions
Microsoft
created on 2019-06-06
| a screenshot of a video game | 28.5% | |
| a screenshot of a cell phone | 28.4% | |
| a screenshot from a cell phone | 28.3% | |
Clarifai
created by general-english-image-caption-blip on 2025-05-05
| a photograph of a chart of a chart of the united states | -100% | |
Google Gemini
Created by gemini-2.0-flash-lite on 2025-05-06
Here is a description of the image:
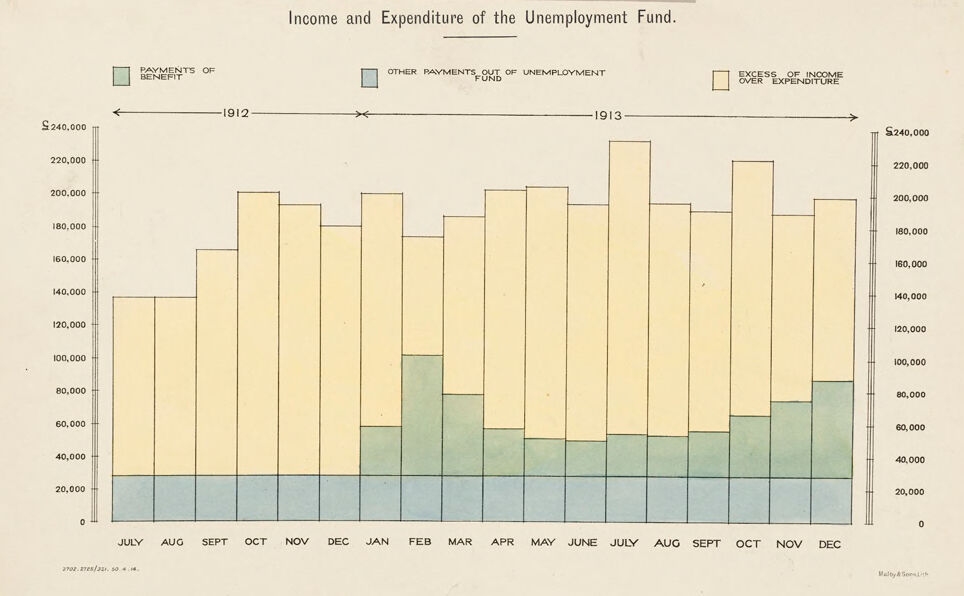
The image is a bar graph chart from the British Board of Trade. It visualizes the "Income and Expenditure of the Unemployment Fund" across the months of July 1912 through December 1913.
Here is a breakdown of the visual elements:
- Title: "British Board of Trade / Labour Exchanges and Unemployment Insurance / Income and Expenditure of the Unemployment Fund." This informs the subject matter.
- X-axis (Horizontal): Represents time, with the months from July 1912 to December 1913 clearly labeled. The graph stretches across this time frame.
- Y-axis (Vertical): Indicates monetary value, marked in increments of $20,000, up to a maximum of $240,000.
- Bar Graph Construction: The graph uses bars to represent the financial data. The bars are composed of multiple colored segments.
- Blue (Payments of Benefit): The bottom section of each bar is blue, representing "Payments of Benefit." This shows the amount of funds distributed.
- Green (Other Payments out of Unemployment Fund): Above the blue section is a green portion representing "Other Payments out of Unemployment Fund," which shows other financial allocations..
- Yellow (Excess of Income over Expenditure): Above the other colored section, is a yellow section, representing "Excess of Income over Expenditure." This portion of the bar indicates the remaining income.
- Labels: There are labels marking the key elements: "Payments of Benefit," "Other Payments Out of Unemployment Fund," and "Excess of Income Over Expenditure." These clarify the meaning of the different colored sections.
- Overall Trend: While a precise analysis requires the exact values, the graph depicts the ebb and flow of income, benefit payments, and other expenses over time.
- Additional Information: There are other labels in the chart such as "Malby & Sons lith" that is located at the lower right, as well as "2702. 2765/21. 50. 4.14." that is located at the lower left.
Created by gemini-2.0-flash on 2025-05-06
The image is a bar graph illustrating the income and expenditure of the Unemployment Fund, presented by the British Board of Trade, Labour Exchanges and Unemployment Insurance, for the years 1912 and 1913. The graph has a vertical axis labeled in thousands of dollars, ranging from $0 to $240,000. The horizontal axis spans the months from July 1912 to December 1913. The legend indicates that the green portions of the bars represent "Payments of Benefit," the blue portions stand for "Other Payments Out of Unemployment Fund," and the yellow portions denote "Excess of Income Over Expenditure." The graph indicates a fluctuation in the unemployment fund throughout the time period. The income generally exceeds the expenditure, except for specific months where payments of benefit increase, notably in January 1913 and to a lesser extent in December 1913.
Text analysis
Amazon