Machine Generated Data
Tags
Color Analysis
Feature analysis
Amazon
| Insect | 96.8% | |

Categories
Imagga
| text visuals | 93.2% | |
| paintings art | 6.7% | |
Captions
Microsoft
created by unknown on 2022-01-15
| diagram | 92.1% | |
OpenAI GPT
Created by gpt-4o-2024-05-13 on 2025-01-04
The image depicts a series of pencil sketches on a piece of paper, likely illustrating various optical or color theories. The sketches include geometric shapes with labels and lines connecting points. The prominent elements are:
Top-left sketch: A geometric diagram with lines radiating from a central point and extending towards various points labeled with color abbreviations such as Y (Yellow), R (Red), G (Green), B (Blue), and possible other letters like T and V.
Top-center sketch: A diagram with overlapping shapes, likely illustrating color overlap or intensity with some areas shaded, possibly representing different color combinations or spectrum.
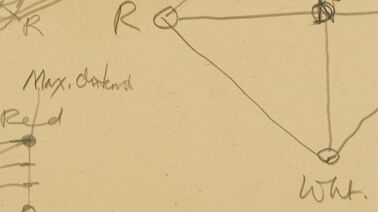
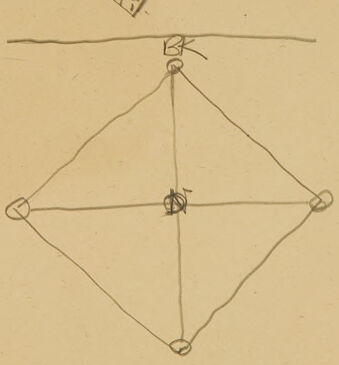
Top-right sketch: A diamond-shaped diagram with points labeled Y (Yellow), Bl (Black), V, and Wht (White), connected by lines, likely creating a color relationship map.
Bottom-left sketch: A circular diagram with lines intersecting it, labeled with color initials Y (Yellow), G (Green), D, R (Red), and another possibly being MV. The lines form a symmetrical pattern possibly representing a color wheel.
Bottom-center sketch: Similar to the top-right diagram, but with abbreviations possibly reinterpreted, labeled Bl, G, R and Wht (White), again interconnected by lines outlining a diamond shape.
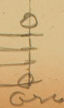
Bottom-right sketch: A smaller, more simplified diagram consisting of curved and straight lines with labels such as Green, Yellow, and Red, along with a notation, likely a part of a color intensity or frequency distribution. The word "Max. Intensity" is also visible.
Overall, the diagrams seem to be depicting relations between primary colors, intensity, and color theory concepts.
Created by gpt-4 on 2024-02-06
This image appears to depict several hand-drawn geometric diagrams. These diagrams are sketchy and appear to be conceptual in nature, with variations in the shapes presented. They may represent design ideas or experimental concepts. The diagrams include annotations with letters possibly indicating different points or elements; for example, some points are marked with "R," "G," "B," "Y," which could stand for Red, Green, Blue, Yellow respectively, indicating a discussion of color in the context of the diagrams.
There are six distinct diagrams, each with different configurations and lines connecting various points. One of them is shaded in part, suggesting a three-dimensional form. Some have overlapping shapes, while others have outer shapes pointed to by arrows, indicating direction, motion, or perspective.
Below one of the diagrams, there is a handwritten note that reads "Max. obstruction." Further below, there is another note, possibly "Red" or an abbreviation followed by another word that is unclear. The bottom left corner shows a partially visible word, which seems to say "green."
The overall impression is that these sketches are exploratory, perhaps part of a brainstorming process in an academic or creative field, possibly related to optics, geometry, or some kind of design discipline. The vintage look of the paper and the drawing style suggest that this could be a historical document.
Anthropic Claude
Created by claude-3-haiku-48k-20240307 on 2024-03-30
The image appears to be a hand-drawn diagram or schematic that includes various geometric shapes, lines, and labels. The central elements seem to be triangular and diamond-shaped forms connected by intersecting lines and arrows. The diagram also includes some text labels, such as "Rad", "Wht", and "Mag. cont.". Overall, the image appears to be some kind of technical or engineering diagram, though the exact subject matter is unclear without additional context.
Meta Llama
Created by us.meta.llama3-2-90b-instruct-v1:0 on 2024-12-26
The image depicts a collection of hand-drawn geometric shapes and diagrams on a yellowed paper background. The drawings appear to be sketches or studies for a larger work, possibly an architectural or engineering project.
Key Features:
- Geometric Shapes: Various geometric shapes, including triangles, squares, circles, and lines, are scattered throughout the page.
- Diagrams: Several diagrams are present, showcasing different configurations of shapes and lines. These diagrams may represent different stages of a design process or alternative solutions to a problem.
- Annotations: Handwritten notes and annotations are visible in the margins and near the diagrams. These notes likely provide context or explanations for the drawings.
- Paper Background: The yellowed paper background suggests that the image is an old document or a reproduction of an archival material.
Overall Impression:
The image conveys a sense of creativity and problem-solving. The variety of shapes and diagrams indicates that the artist or designer was exploring different ideas and approaches to achieve a specific goal. The handwritten notes and annotations add a personal touch, suggesting that the image is a unique and original work rather than a mass-produced document.
Created by us.meta.llama3-2-11b-instruct-v1:0 on 2024-12-02
The image presents a collection of hand-drawn sketches on a piece of aged paper, showcasing various geometric shapes and lines. The sketches appear to be a study or exploration of different shapes and their relationships, with each drawing featuring a unique combination of lines, circles, and other geometric elements.
Key Features:
- Geometric Shapes: The sketches include a range of geometric shapes, such as triangles, squares, circles, and more complex forms like polyhedra.
- Lines and Circles: Lines and circles are used to create the shapes and explore their properties. Some sketches feature straight lines, while others include curved lines or circular arcs.
- Relationships Between Shapes: The sketches also investigate the relationships between different shapes, such as how they intersect, overlap, or fit together.
- Aged Paper: The background of the image is a piece of aged paper, which adds a sense of history and nostalgia to the overall appearance.
Overall Impression:
The image conveys a sense of curiosity and exploration, as if the creator is experimenting with different shapes and their interactions. The use of aged paper and the simple, hand-drawn style of the sketches gives the image a warm and intimate feel, suggesting a personal and creative process.
Google Gemini
Created by gemini-2.0-flash-lite on 2025-05-18
Here's a description of the image:
Overall Impression:
The image is a sketch, likely a study or a preparatory drawing, on a sheet of paper with a slightly aged, sepia-toned color. It appears to be a collection of geometric diagrams and color theory explorations. The hand-drawn lines suggest the artist was exploring relationships between colors and shapes.
Detailed Description:
Various Diagrams: The image is densely packed with several diagrams and sketches. These include:
- Color Wheels and Pyramids: Several of the figures depict color wheel-like diagrams with lettered points labeled "Y" (Yellow), "R" (Red), "B" (Blue), "G" (Green), "V" (Violet), "Bk" (Black), and "Wht." (White). Some shapes are diamond shaped and some include a color gradient or shading.
- Geometric Shapes: There are also geometrical shapes of a pyramidal or triangular shape.
- Eye Diagram: One diagram resembles an eye, with various lines and circles suggesting exploration of vision or light.
- Curved Lines: A series of curved lines originating from a point, which also seems to explore gradients or visual intensity.
Labels and Annotations: The diagrams are peppered with labels, indicating the artist's process of exploration.
- "Red" is noted on one of the diagrams.
- "Max. intend" is another note, possibly referring to maximum intensity.
Style and Medium:
- The drawing is done in pencil, judging by the lines' gray tone.
- The lines are freehand, suggesting a casual, exploratory approach rather than a highly refined technical drawing.
Interpretation:
The image is likely a collection of preliminary sketches related to color theory, optical perception, or geometric art principles. The artist appears to be working out visual concepts through drawing diagrams and using color labels.
Created by gemini-2.0-flash on 2025-05-18
The image is a sketch on a tan or light brown paper. The sketch appears to be a collection of geometric diagrams and abstract figures drawn in pencil. There are several diagrams that look like color wheels or diagrams related to color theory, with points labeled with color names such as "Y" (yellow), "R" (red), "G" (green), "B" (blue), "Blk" (black), and "Wht" (white). Some of the figures are more abstract, like a geometric form filled with lines and patterns. The sketch also includes handwritten notes, possibly related to the diagrams, and a curved set of lines with points marked along a vertical axis. The overall impression is that of preliminary sketches or notes, possibly for a design or theoretical concept related to color and geometry.
Text analysis
Amazon