Machine Generated Data
Tags
Color Analysis
Feature analysis
Amazon
| Book | 100% | |
Categories
Imagga
| text visuals | 99.9% | |
Captions
Microsoft
created on 2020-04-25
| a screenshot of a computer | 79% | |
| a close up of a computer | 77.9% | |
| a close up of a laptop | 71.8% | |
OpenAI GPT
Created by gpt-4 on 2024-12-13
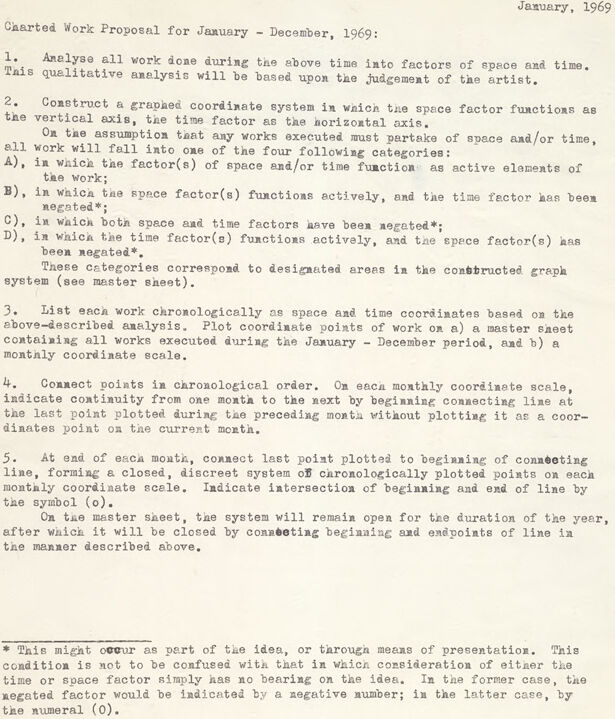
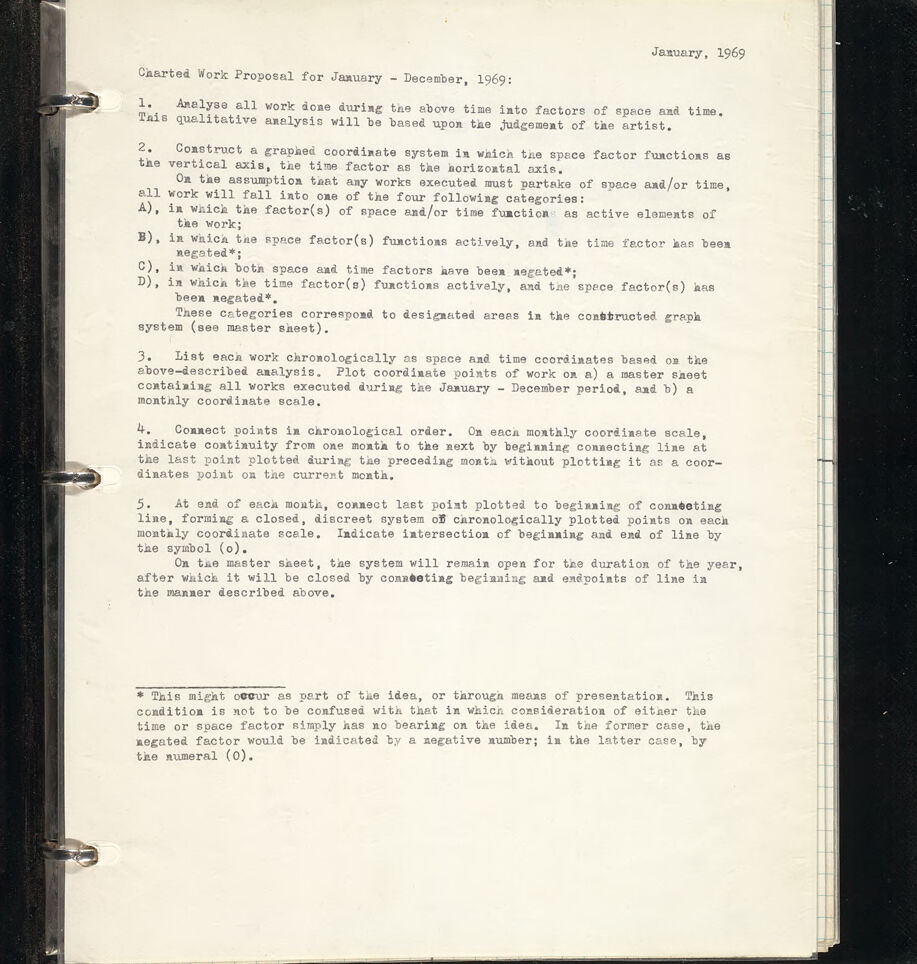
The image shows a document, specifically a page from a binder or notebook, containing typewritten text outlining a "Charted Work Proposal for January - December, 1969.” The proposal includes several numbered steps to analyze work by factors of space and time, construct a graph, and plot points on a coordinate system to represent this analysis. Each step is described in a detailed and formal manner, using technical language that suggests this is for a structured project or research task. The document also features handwritten notes, such as "January, 1969" at the top right corner, possibly indicating when this proposal was created or for which period it was relevant. There is a footnote explaining that the negation of space or time factors could occur as part of the idea or means of presentation, clarifying that negation should be indicated by a negative number or the numeral (0). The overall impression is that this document relates to a conceptual or analytical project, and it appears to be in draft or planning stages due to the typed and handwritten elements combined. This might be part of an artist's planning process or an academic study, although the specific context isn't provided in the image.
Created by gpt-4o-2024-05-13 on 2024-12-13
The image depicts a typed document titled "Charted Work Proposal for January - December, 1969". It is contained in a black binder, and it outlines a detailed work proposal with numbered points focusing on the analysis and graphical representation of work in terms of space and time. Here is a summary of the key points: 1. The proposal involves analyzing all work within the specified period using factors of space and time, judged qualitatively by the artist. 2. It suggests the construction of a graphed coordinate system, with space factors as the vertical axis and time factors as the horizontal axis. The works performed would be classified into four categories based on the active function of space and time. 3. It requires listing each work chronologically in terms of space and time, plotting them on a master sheet and also on monthly coordinate scales. 4. The points are to be connected in chronological order to indicate continuity from month to month. 5. At each month's end, the last plotted point should be connected to the beginning of the next to maintain a closed, discreet system on the coordinate scale, with intersections indicated by specific symbols. The document also contains a footnote explaining the concept of negated factors, which indicates whether spatial or temporal considerations have no bearing on the idea, using either negative numbers or the numeral (0). The document provides a systematic approach to analyzing, cataloging, and visualizing the work over the specified period through a detailed, structured format.
Anthropic Claude
Created by claude-3-haiku-20240307 on 2024-12-13
The image appears to be a typed work proposal from January 1969 titled "Charted Work Proposal for January - December, 1969". The proposal outlines a plan to analyze all work done during the specified time period and construct a graphed coordinate system to visualize the "space factor" functions over time. It describes categorizing the work into four areas based on how the space and time factors are utilized, and provides instructions for plotting the work chronologically on a monthly coordinate scale. The purpose seems to be creating a system to track and analyze the work and its relationship to space and time factors over the course of the year.
Created by claude-3-5-sonnet-20241022 on 2024-12-13
This image shows a typed document dated January, 1969, titled "Charted Work Proposal for January - December, 1969." It appears to be a detailed instruction document that outlines a method for analyzing and charting work over time and space. The document is organized into 5 numbered points that describe how to: 1. Analyze work into factors of space and time 2. Construct a graphed coordinate system with specific categories (A through D) 3. Plot work chronologically 4. Connect points in chronological order 5. Create connections between monthly coordinate points The document includes a footnote at the bottom marked with an asterisk that provides additional clarification about certain conditions. The page appears to be held in some kind of binder or folder with rings visible on the left side. The text is typewritten in a classic typewriter font on what appears to be white paper, and the overall document has a formal, academic or professional appearance.
Meta Llama
Created by us.meta.llama3-2-11b-instruct-v1:0 on 2024-12-13
The image shows a scanned document of a typed page, likely from a work proposal, with the title "Charted Work Proposal for January - December, 1969" at the top. The page is divided into five numbered sections, each detailing a specific task or objective for the work proposal. * **Section 1: Analyze all work done during the above time into factors of space and time.** * This section instructs the artist to analyze all work done during the specified time period and categorize it based on its spatial and temporal aspects. * **Section 2: Construct a graphed coordinate system in which the space factor functions as the vertical axis, the time factor as the horizontal axis.** * This section requires the artist to create a graphed coordinate system with the space factor on the vertical axis and the time factor on the horizontal axis. * **Section 3: List each work chronologically as space and time coordinates based on the above-described analysis.** * This section asks the artist to list each work in chronological order, using the space and time coordinates determined in the previous section. * **Section 4: Connect points in chronological order. On each monthly coordinate scale, indicate continuity from one month to the next by beginning connecting line at the last point plotted during the preceding month without plotting it as a coordinate point on the current month.** * This section instructs the artist to connect the points in chronological order, using a monthly coordinate scale to indicate continuity between months. * **Section 5: At end of each month, connect last point plotted to beginning of connecting line, forming a closed, discreet system of chronologically plotted points on each monthly coordinate scale. Indicate intersection of beginning and end of line by the symbol (o).** * This section requires the artist to connect the last point plotted to the beginning of the connecting line, forming a closed system of chronologically plotted points on each monthly coordinate scale. The intersection of the beginning and end of the line should be indicated by the symbol (o). In summary, the image shows a scanned document of a typed page outlining a work proposal for January to December 1969. The proposal consists of five numbered sections, each detailing a specific task or objective related to analyzing and graphing the work done during the specified time period.
Created by us.meta.llama3-2-90b-instruct-v1:0 on 2024-12-13
The image presents a scanned page from a binder, featuring a typed document with the title "Charted Work Proposal for January - December, 1969." The document is divided into five sections, each numbered and accompanied by a brief description. The text is presented in black ink on white paper, with the page secured in a clear plastic binder. **Key Features:** * **Title:** Charted Work Proposal for January - December, 1969 * **Sections:** Five numbered sections with brief descriptions * **Text Color:** Black ink * **Paper Color:** White * **Binder:** Clear plastic binder **Visual Description:** The image displays a scanned page from a binder, showcasing a typed document with a clear title and organized sections. The use of black ink on white paper provides good contrast, making the text easily readable. The clear plastic binder adds a touch of professionalism to the overall appearance.
Amazon Nova
Created by amazon.nova-lite-v1:0 on 2025-02-26
The image is a page from a document titled "Charted Work Proposal for January - December, 1969." The page is part of a larger document, likely a project proposal or report, and it is dated January 1969. The page is structured with a numbered list and includes instructions or guidelines for analyzing and categorizing work done during the specified time period. The content is focused on categorizing work based on factors of space and time, constructing a graphed coordinate system, and plotting work on a master sheet. The text is written in a formal, academic style, and the page appears to be a part of a larger, systematic approach to organizing and visualizing work data.
Created by amazon.nova-pro-v1:0 on 2025-02-26
The image is a page from a document titled "Charted Work Proposal for January - December, 1969." The page is dated January 1969 and contains a list of steps or instructions for analyzing and categorizing work done during that year. The text is written in a clear, legible font and is organized into numbered sections. The first section outlines the process of analyzing work into factors of space and time, with a qualitative analysis based on the artist's judgment. The second section describes the construction of a graphed coordinate system where the space factor functions as the vertical axis and the time factor as the horizontal axis. It also categorizes work into four types based on the active or neglected factors of space and time. The third section instructs to list each work chronologically as space and time coordinates based on the previous analysis and plot them on a master sheet and a monthly coordinate scale. The fourth section explains how to connect points in chronological order on the monthly coordinate scales, indicating continuity from one month to the next. The fifth section details how to connect the last point plotted to the beginning of the connecting line at the end of each month, forming a closed, discreet system of chronologically plotted points. It also mentions indicating the intersection of the beginning and end of the line by a specific symbol. The document concludes with a note clarifying that a condition where either the time or space factor has no bearing on the idea should not be confused with a situation where one factor is neglected. In the former case, the neglected factor would be indicated by a negative number, while in the latter, it would be indicated by the numeral 0.
Text analysis
Amazon