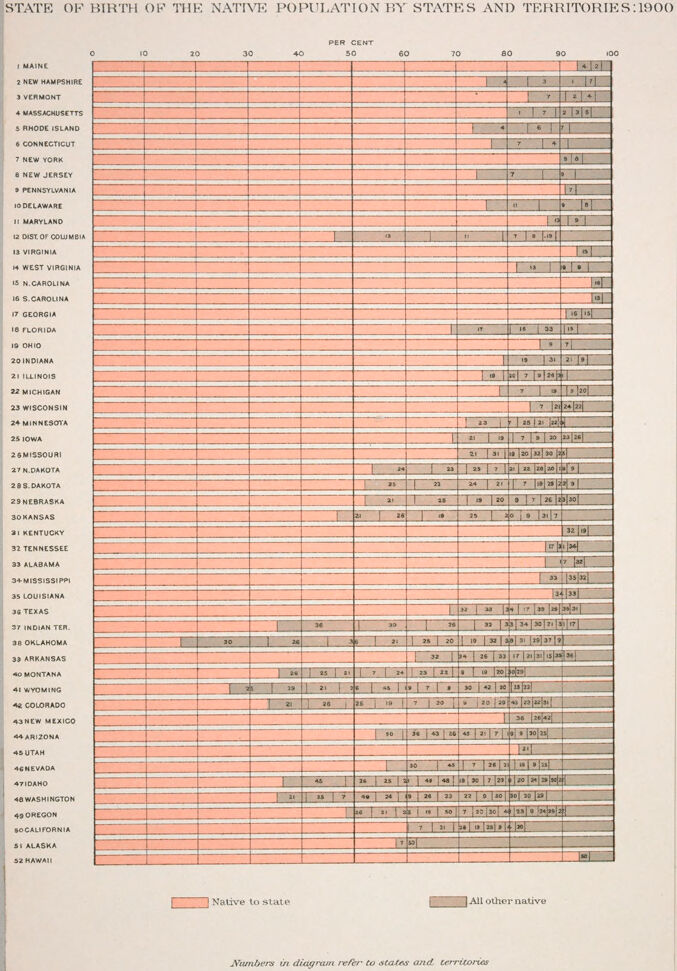
STATE OF BIRTH OF THE NATIVE POPULATION BY STATES AND TERRITORIES:1900
PE
CENT
10
80
OC
20
40
60
412
MAINE
3
2 NEW HAMPSHIRE
VERMONT
MASSACHUSETTS
4
RHODE ISLAND
CONNECTICUT
7 NEW YORK
7
8 NEW JERSEY
PENNSYLVANIA
O DELAWARE
MARYLAND
DIST OF COLUMBIA
VIRGINIA
4 WEST VIRGINIA
iS N.CAROLINA
16 s.CAROLINA
17 GEORGIA
633
1e FLORIDA
19 OHIO
20INDIANA
...
LINOE
MICHIGAN
IN
23 as a
...
21 D
21 31 20 3
25 JOWA
26MISSOURI
24
2s 23
27 N.DAKOTA
24 217
28S.DAKOTA
as 20
25
Tos cal
32 19
29NEBRASKA
26
30 KANSAS
a1 KENTUCKY
32 TENNESSEE
33 ALABAMA
34MISSISSIPP
34 33
35 LOUISIANA
26 32 34 30 27
2 2 2019 32 ap 3 37D
226 33 17 21s
2 25 2 7223 2 202
2 21 7 3 2 30 2 22
36
TER
10 OKLAHOMA
32
33 ARKANSAS
MONTANA
2
WYOMING
2 20
26 19
COLORADO
I36 2e42
43 NEW MEXIco
4 ARI2ONA
45 UTAH
4 26 EIODE
4GNEVADA
45
47IDAHO
2 27424 2 23 22 5o 3 20
48 WASHINGTON
9OREGON
721 2 Es 2
SOCALIFORNIA
ALASKA
se
52 HAWAIL
Native to state
All other native
states and territories
Numbers in diagram refer