Machine Generated Data
Tags
Color Analysis
Feature analysis
Categories
Imagga
created on 2019-06-05
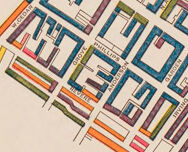
text visuals | 98.3% | |
paintings art | 1.6% | |
Captions
Microsoft
created by unknown on 2019-06-05
a close up of text on a white background | 77.8% | |
a close up of text on a black background | 72.3% | |
a close up of text on a white surface | 72.2% | |
Salesforce
Created by general-english-image-caption-blip on 2025-05-16
a photograph of a map of a city with a map of the city
Created by general-english-image-caption-blip-2 on 2025-07-05
an old map of the city of new york
OpenAI GPT
Created by gpt-4o-2024-11-20 on 2025-06-09
This is a historical map titled "Map Illustrating the Industrial Character of the Population in the West End, Boston." It depicts the distribution of various social and economic classifications within this area of Boston.
The map is color-coded, with blocks representing different industrial and occupational groups. A legend at the bottom explains the color scheme:
- Blue: Unskilled workers
- Green: Mixed population (2-1 and 3 mixed)
- Yellow: Skilled workers
- Orange/Red: Mixed population (4-3 and 5 mixed)
- Purple: Clerks, etc.
- Dark Yellow/Gold: Mixed population (6-1 and 5 mixed)
The area is bounded by Charlesbank, Causeway Street, and North Union Station is labeled. Streets in the West End are marked, and the map emphasizes patterns of socioeconomic variation across neighborhoods.
This is a sociological and urban planning map meant to categorize industrial and residential demographics in Boston during the late 19th or early 20th century.
Created by gpt-4o-2024-08-06 on 2025-06-09
The image is a historical map illustrating the industrial character of the population in the West End of Boston. It is color-coded to represent different types of employment or economic status categories. The map includes several blocks or areas marked with different colors:
- Blue indicates areas with unskilled workers.
- Green indicates areas with a mix of categories 1 and 3.
- Orange represents areas with skilled workers.
- Red indicates areas with a mix of categories 4 and 5.
- Yellow represents areas with clerks and similar professions.
- Purple indicates areas with a mix of categories 6 and 1 and 5.
The map has several streets labeled including Charlesbank and Causeway, and it notes the presence of the North Union Station. There is a small compass rose in the upper right corner showing orientation, and a scale in rods at the bottom left. The design and scale suggest it is from an older period, possibly the late 19th or early 20th century.
Anthropic Claude
Created by anthropic.claude-3-haiku-20240307-v1:0 on 2025-06-19
This image appears to be a map illustrating the industrial character of the population in the South End of Boston. The map is divided into color-coded sections, with each color representing a different level of industrial skill or occupation among the residents. The legend at the bottom of the map provides a key to the color-coding, indicating the range of occupations from "unskilled" to "clerks, etc." The map also includes the location of the North Union Station, which seems to be a prominent landmark in the area. Overall, the image provides a visual representation of the industrial and occupational makeup of the population in this part of Boston.
Created by us.anthropic.claude-3-5-sonnet-20241022-v2:0 on 2025-06-19
This is a historical map illustrating the "Industrial Character of the Population" in Boston's West End. The map appears to be a demographic visualization where different colors represent various occupational categories of residents:
- Dark blue represents "Unskilled"
- Mixed colors represent "2-3 & Mixed"
- Pink/red represents "Skilled"
- Yellow represents "Clerks, etc."
- Green represents "4-5 & Mixed"
The map shows a detailed street layout of the West End neighborhood, with blocks colored according to the predominant occupational category of its residents. The North Union Station is marked on the map, and there's a scale bar at the bottom. The overall layout shows a dense urban grid pattern typical of historic Boston, with the streets arranged at various angles. This type of map was likely used for urban planning or sociological studies, providing insight into the social and economic makeup of the neighborhood during what appears to be the late 19th or early 20th century.
Meta Llama
Created by us.meta.llama3-2-11b-instruct-v1:0 on 2025-06-10
The image depicts a map titled "Map Illustrating the INDUSTRIAL CHARACTER of the POPULATION in the WEST END BOSTON." The map is divided into various sections, each representing a different type of industry or occupation. The sections are color-coded, with each color corresponding to a specific industry or occupation.
The map appears to be hand-drawn and features a key in the bottom-right corner that explains the color-coding system. The key lists six categories, including "Unskilled," "Skilled," "Clerks Etc.," and "Mixed." Each category is represented by a different color, such as blue for "Unskilled" and yellow for "Clerks Etc."
The map also includes several labels and annotations, including the names of streets and buildings. In the top-left corner, there is a label that reads "S 0 0 3 3," which may indicate the scale of the map or the location of the data.
Overall, the map provides a visual representation of the industrial character of the population in the West End of Boston. It suggests that the area was home to a diverse range of industries and occupations, with some areas having a higher concentration of certain types of workers than others.
Answer: The map illustrates the industrial character of the population in the West End of Boston, with different sections representing various industries and occupations.
Created by us.meta.llama3-2-90b-instruct-v1:0 on 2025-06-10
The image presents a map of the West End neighborhood in Boston, Massachusetts, titled "Map Illustrating the INDUSTRIAL CHARACTER of the POPULATION in the WEST END BOSTON." The map is divided into sections, each representing a different type of industrial character, such as unskilled, skilled, clerks, etc. The sections are color-coded, with a key provided in the bottom-right corner to explain the meaning of each color.
The map appears to be from the late 19th or early 20th century, based on the style of the typography and the layout of the streets. It is likely that the map was created by a government agency or a private company to provide information about the industrial character of the West End neighborhood.
Overall, the map provides a valuable insight into the economic and social structure of the West End neighborhood during a specific period in history. It can be used by historians, researchers, and urban planners to understand the development of the neighborhood and its impact on the surrounding community.
Amazon Nova
Created by amazon.nova-lite-v1:0 on 2025-06-06
The image is a map titled "Map Illustrating the Industrial Character of the Population in the West End Boston." It shows a map of a specific area in Boston, with buildings and streets colored to represent the industrial character of the population in the West End of Boston. The map includes a legend that explains the different colors used to represent different types of industries and occupations. The map also includes a scale in rods and miles, indicating the size of the area being represented. The map appears to be an old map, possibly from the 19th century, based on the style of the map and the language used in the title.
Created by amazon.nova-pro-v1:0 on 2025-06-06
The image is a map titled "Map Illustrating the Industrial Character of the Population in the West End Boston." The map is divided into various colored sections, each representing different industrial and demographic characteristics of the population. The colors used are blue, red, orange, yellow, green, and purple, each with a specific meaning as indicated by the legend on the right side of the map.
The legend lists the following categories:
- Unskilled
- 1-1 & Mixed
- Skilled
- 1-3 & Mixed
- Clerks, etc.
- 6-1 & Mixed
The map includes street names and major landmarks, such as the "North Union Station" and "Causeway." The streets are labeled, and the map also includes a scale at the bottom, indicating distances in rods and miles.
The map is detailed, showing the layout of the streets and the distribution of the population based on their industrial character. The different colors and patterns help to visually distinguish between the various categories, making it easier to understand the demographic distribution in the West End of Boston.
The map also includes a compass rose in the upper right corner, indicating the orientation of the map with north pointing upwards. This helps in understanding the geographical layout and orientation of the area depicted.
Overall, the map serves as a visual representation of the industrial and demographic characteristics of the population in the West End of Boston, providing valuable insights into the socio-economic structure of the area during the time the map was created.
Google Gemini
Created by gemini-2.0-flash on 2025-05-24
Here is a description of the image:
The image shows a vintage, color-coded map titled "Map Illustrating the INDUSTRIAL CHARACTER of the POPULATION in the WEST END BOSTON." The map outlines the street layout of the West End of Boston, including areas along the Charlesbank. Streets like "Charles," "Allen," "Causeway," and "Cambridge" are labeled. The buildings within the map are colored in different hues, each representing a different occupational class: blue for unskilled, magenta for 2-1 & 3 mixed, red for skilled, orange for 4-3 & 5 mixed, yellow for clerks etc., and green for 6-1 & 5 mixed. A scale is provided at the bottom left of the map, indicating measurements in rods and miles. The North Union Station is marked on the map's eastern side. A simple compass rose is depicted in the upper right corner, indicating North. The map appears to be bordered with a thin black line and is set against a plain, off-white background.
Created by gemini-2.0-flash-lite on 2025-05-24
Here's a description of the image:
Overall:
The image is a vintage map illustrating the industrial character of the population in the West End of Boston. The map is likely a historical document, based on its style and the information presented.
Content:
- Map Elements: The map depicts a street layout of the West End of Boston. It shows the names of some streets, such as Cambridge, Charles, and Causeway. Also indicated are features like the Charles River, and the North Union Station.
- Color Coding: The primary feature of the map is its color-coding. Different colors likely represent different categories or levels of industrial skill or economic status of the population in each area. The legend at the bottom defines these categories:
- Unskilled (presumably working class)
- 2-1 & 3 Mixed
- Skilled
- 4-3 & 5 Mixed
- Clerks etc. (likely white-collar workers)
- 6-1 & 5 Mixed
- Layout and Style: The map has a traditional cartographic style. It includes a title, scale bar (in rods), and a compass rose to indicate direction.
- Date/Period: The vintage appearance suggests this map is from the early to mid-20th century or earlier.
Purpose and Context:
- The map was likely used for urban planning, sociological studies, or as part of a report to understand the social and economic makeup of the West End neighborhood.
- The map's focus on industrial character likely reflects an era when industrial employment was a significant factor in urban life and social stratification.
Mistral Pixtral
Created by us.mistral.pixtral-large-2502-v1:0 on 2025-06-05
The image is a historical map titled "Map Illustrating the Industrial Character of the Population in the West End, Boston." It visually represents the occupational distribution of residents in the West End neighborhood of Boston. The map uses color coding to indicate different types of occupations or skill levels. Here is a detailed summary:
Color Coding:
- Blue (1. Unskilled): Areas with predominantly unskilled laborers.
- Red (2. 1 & 2 Mixed): Areas with a mix of unskilled and skilled laborers.
- Yellow (3. Skilled): Areas with predominantly skilled laborers.
- Green (4. 3 & 4 Mixed): Areas with a mix of skilled and clerical workers.
- Orange (5. Clerks, etc.): Areas with predominantly clerical workers.
- Purple (6. 1 & 5 Mixed): Areas with a mix of unskilled and clerical workers.
Geographical Features:
- The map includes key landmarks such as the Charles Bank, North Union Station, and the Causeway.
- Streets and blocks are clearly delineated, showing the layout of the neighborhood.
Scale:
- The map includes a scale in rods and feet, indicating the distance represented on the map.
Purpose:
- The map aims to provide a visual representation of the industrial character of the population, highlighting the distribution of different types of workers across the West End of Boston.
This map is likely from the late 19th or early 20th century, reflecting the socio-economic structure of the area during that time. It provides valuable historical insight into the occupational demographics of the West End neighborhood.
Qwen
Created by Qwen/Qwen2.5-VL-7B-Instruct on 2025-07-05
The image is a historical map titled "Map Illustrating the INDUSTRIAL CHARACTER of the POPULATION in the WEST END BOSTON." It is a choropleth map, which uses different shades of color to represent different categories of data. Each color corresponds to a specific industrial or occupational group, as indicated by the legend on the bottom right of the map.
The legend breaks down the categories as follows:
- Unskilled
- 2-1 & 3 Mixed
- Skilled
- 4-3 & 5 Mixed
- Clerks, Etc.
- 6-1 & 5 Mixed
The map shows the West End area of Boston, with streets and block boundaries clearly marked. The map uses color coding to show the distribution of these occupational groups across the area. For example, different shades of purple, blue, and green are used to represent various levels of skill and occupation within the population of the West End.
The map provides a visual representation of the industrial and occupational landscape of the West End, giving insight into the social and economic characteristics of the area during the time this map was created.
Created by Qwen/Qwen2.5-VL-72B-Instruct on 2025-07-05
This image is a historical map titled "Map Illustrating the Industrial Character of the Population in the West End, Boston." It visually represents the occupational characteristics of the residents in the West End neighborhood of Boston through the use of color-coded blocks. The map is oriented with a compass arrow indicating north.
Key features of the map include:
Color-Coded Legend: The legend at the bottom right corner explains the color coding used to represent different categories of industrial character:
- Dark blue: Unskilled
- Light blue: Unskilled and Skilled Mixed
- Pink: Skilled
- Orange: Skilled and Clerks, etc., Mixed
- Yellow: Clerks, etc.
- Green: Unskilled and Skilled and Clerks, etc., Mixed
Street Layout: The map shows a detailed street layout with various streets labeled, such as Charles Street, Leverett Street, and Mill Street. The streets form a grid-like pattern with blocks of buildings.
North Union Station: The map includes a label for North Union Station, indicating its location within the West End.
Charles River: The Charles River is depicted at the top of the map, with the Charlesbank labeled along its edge.
Scale and Compass: There is a scale bar at the bottom left, indicating the scale in rods, and a compass arrow at the top right, showing the orientation of the map.
The map provides a detailed and colorful visualization of the occupational distribution within the West End, likely used for urban planning or sociological studies.