Machine Generated Data
Tags
Color Analysis
Categories
Imagga
| nature landscape | 52.4% | |
| macro flowers | 22.5% | |
| text visuals | 12.2% | |
| events parties | 5.4% | |
| food drinks | 2.6% | |
| paintings art | 2.1% | |
Captions
OpenAI GPT
Created by gpt-4o-2024-05-13 on 2024-12-31
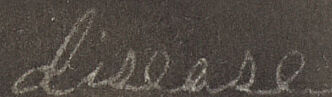
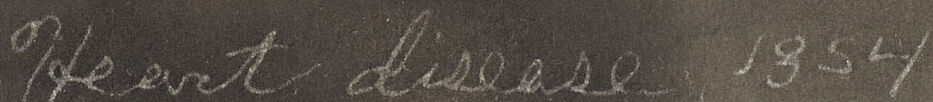
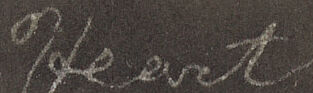
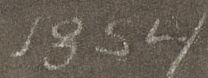
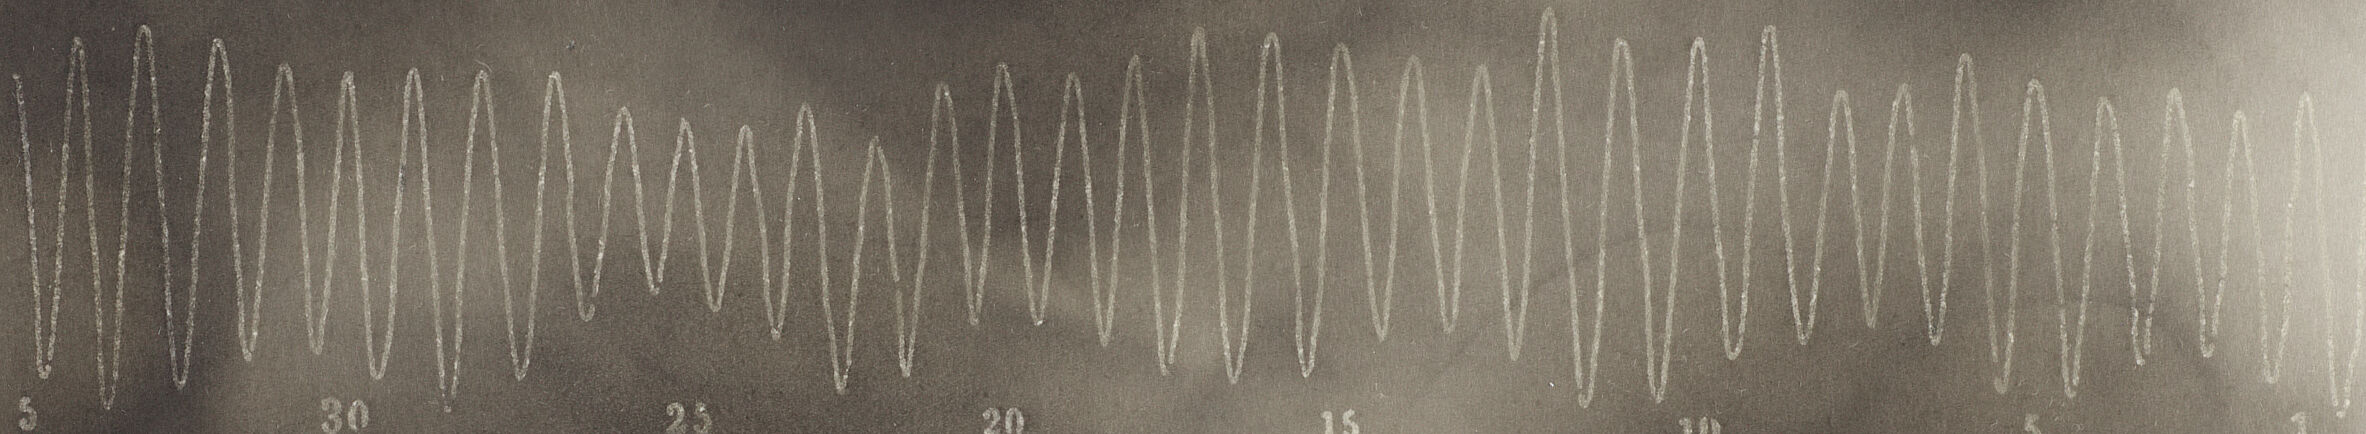
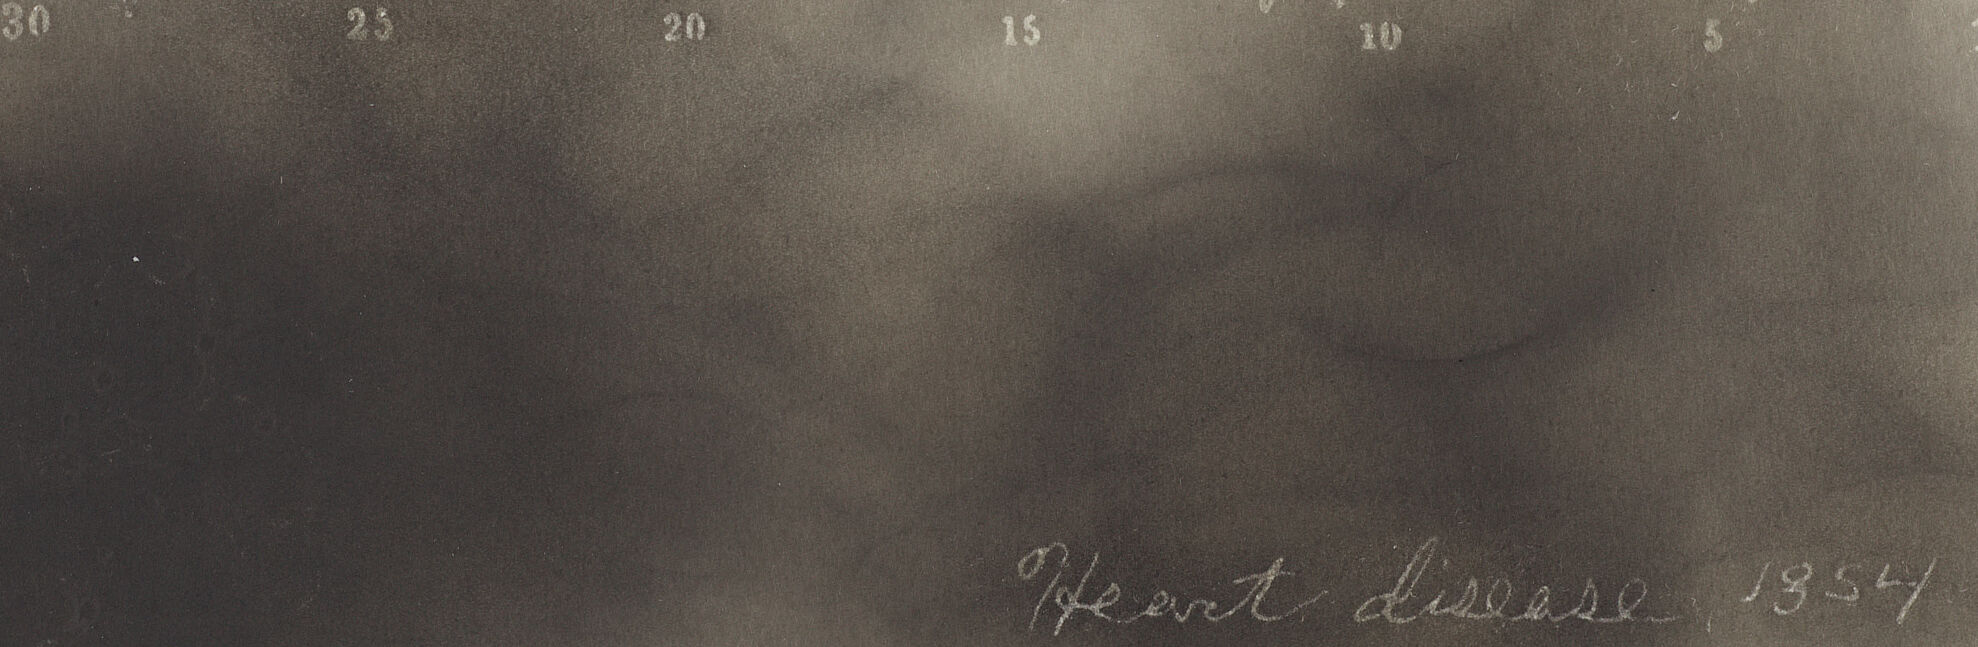
This image is a black and white photograph that appears to feature an abstract representation of a waveform or oscillation pattern across the center. The waveform is depicted with a fluctuating, wavy line, and there are numbers below the line, spaced out at consistent intervals, ranging from 1 to 35. The numbers are arranged in descending order from left to right (35 on the left, 1 on the right). In the lower right corner, there's handwritten text that reads "Heart disease 1954." The background of the image is like a smoky or cloudy texture, enhancing its abstract feel.
Created by gpt-4 on 2024-11-15
You've provided an image of what appears to be an older black and white photograph or print showing an oscillatory wave form pattern across the horizontal midsection. The background is a diffuse, smoky gradient that fades from darker at the top to lighter at the bottom. Numbers are associated with the peaks of the waveforms, possibly indicating amplitude or some form of measurement increments. They read from left to right: "5, 30, 25, 20, 15, 10, 5, 1." At the bottom right corner, there is handwriting that states "Heart disease 1954," suggesting this might be a representation of an electrocardiogram or other medical recording related to cardiac function from the year 1954. The image has a vintage quality to it, with white margins framing the picture area.
Anthropic Claude
Created by claude-3-5-sonnet-20241022 on 2024-12-27
This appears to be a historical medical or scientific image from 1954, showing what looks like a waveform or oscillation pattern. The image shows a series of regular sine waves or oscillations marked with numbers from 1 to 30 along the bottom. The notation at the bottom reads "Heart disease, 1954". It's likely this is an early electrocardiogram (ECG/EKG) recording, which measures the electrical activity of the heart. The image has a vintage quality with its sepia-like tones and slightly grainy appearance, typical of medical documentation from that era.
Created by claude-3-haiku-20240307 on 2024-11-14
The image appears to be a black and white photograph showing a series of wave-like patterns. The patterns are arranged horizontally across the image, with numerical labels at the bottom indicating the scale or measurements. The image seems to be a scientific or technical recording, likely capturing some type of wave or vibration data. There are no identifiable human faces or individuals in this image.
Meta Llama
Created by us.meta.llama3-2-90b-instruct-v1:0 on 2024-12-25
This image presents a vintage, black-and-white photograph of a line graph, with the title "Heart disease 1954" inscribed in cursive at the bottom right corner. The graph features a series of wavy lines that oscillate between 5 and 30 on the y-axis, with numbers marked at intervals of 5. The x-axis is labeled with numbers ranging from 1 to 30, although some labels are illegible due to the faded quality of the image. The background of the image is a dark gray color, with a white border surrounding the edges. The overall appearance suggests that the image may be a historical document or artifact related to medical research or data analysis.
Created by us.meta.llama3-2-11b-instruct-v1:0 on 2024-11-21
The image presents a black-and-white electrocardiogram (ECG) tracing, which is a graphical representation of the electrical activity of the heart over time. The ECG tracing is displayed on a dark background with white lines and numbers. * **ECG Tracing:** * The ECG tracing is a series of wavy lines that oscillate between positive and negative peaks. * The tracing is divided into five main sections, each representing a different phase of the cardiac cycle. * The sections are labeled with numbers ranging from 1 to 5, indicating the different phases of the cardiac cycle. * **Numbers:** * The numbers on the tracing range from 1 to 5 and are evenly spaced along the x-axis. * Each number corresponds to a specific phase of the cardiac cycle, with 1 representing the P wave, 2 representing the QRS complex, 3 representing the T wave, and 4 and 5 representing the ST segment and U wave, respectively. * **Background:** * The background of the image is a dark gray color, which helps to highlight the white ECG tracing. * The background is also textured, giving it a slightly rough appearance. * **Signature:** * In the bottom-right corner of the image, there is a signature that reads "Heart Disease 1954". * The signature is written in white ink and is difficult to read due to its small size and faded appearance. In summary, the image presents a black-and-white ECG tracing that shows the electrical activity of the heart over time. The tracing is divided into five main sections, each representing a different phase of the cardiac cycle, and is labeled with numbers ranging from 1 to 5. The background of the image is a dark gray color with a textured appearance, and there is a signature in the bottom-right corner that reads "Heart Disease 1954".
Amazon Nova
Created by amazon.nova-lite-v1:0 on 2025-02-25
The image is a black-and-white photograph of a heart rate monitor strip. The strip has a series of wavy lines that represent the heart's electrical activity. The lines are labeled with numbers, ranging from 5 to 30, indicating the heart rate in beats per minute. The image also has a watermark in the bottom right corner that reads "Heart disease 1954." The image is framed with a white border.
Created by amazon.nova-pro-v1:0 on 2025-02-25
The image appears to be a photograph of a heart rate graph. The graph is displayed on a black background, with a white line representing the heart rate. The graph shows a series of peaks and valleys, indicating the heart rate's fluctuations over time. The heart rate starts at around 30 beats per minute and gradually increases to around 150 beats per minute before decreasing again. The graph is accompanied by the text "Heart disease 1954" in the bottom right corner.
Text analysis
Amazon