Machine Generated Data
Tags
Color Analysis
Categories
Imagga
text visuals | 99.8% | |
Captions
Microsoft
created by unknown on 2019-06-05
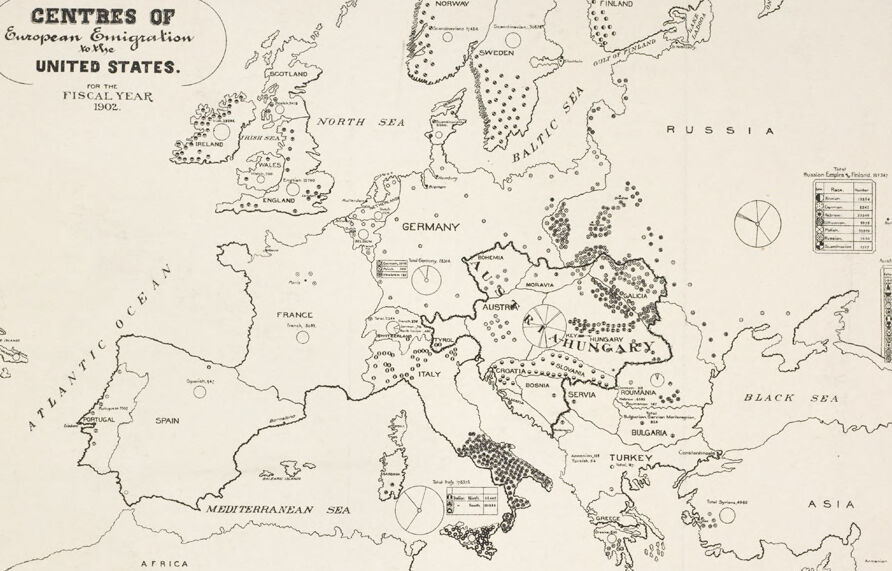
a close up of a map | 67% | |
close up of a map | 62.3% | |
a close up of text on a map | 54.3% | |
Clarifai
created by general-english-image-caption-blip on 2025-05-29
a photograph of a map of europe and the united states | -100% | |
OpenAI GPT
Created by gpt-4o-2024-11-20 on 2025-06-12
This is a historical map titled Centres of European Emigration to the United States for the Fiscal Year 1902. It shows Europe with various dots clustered in different regions, indicating areas of significant emigration activity during that time. The map highlights countries such as Germany, Austria-Hungary, Italy, Russia, and Ireland as prominent sources of emigration.
Key features include:
- Regions of Emigration: High dot density appears in regions like Ireland, southern Italy, parts of Germany, Austria-Hungary, and Russia.
- Major Countries: The map includes labels for countries such as Norway, Sweden, Finland, Russia, Germany, Austria-Hungary, Italy, and more.
- Geographic Markers: Bodies of water, including the Baltic Sea, Black Sea, Mediterranean Sea, and Atlantic Ocean, are labeled, providing geographic context.
- Graphs or Insets: Small pie charts and tables provide data about emigration numbers from specific areas like the Russian Empire and Austrian-Hungarian territories.
This map offers a snapshot of migration patterns from Europe to the United States at the beginning of the 20th century, reflecting significant population movements driven by economic, political, and social factors.
Created by gpt-4o-2024-08-06 on 2025-06-12
The image is a historical map titled "Centres of European Emigration to the United States for the Fiscal Year 1902." It is a black-and-white map depicting Europe and part of Western Asia, focusing on the regions where emigration to the United States was concentrated in 1902.
Key features of the map include:
Geographic Coverage: The map covers Europe, parts of Russia, and regions extending to Turkey. It shows major geographical markers such as the North Sea, Baltic Sea, Atlantic Ocean, Mediterranean Sea, and Black Sea.
Countries and Regions: Countries such as Ireland, England, Norway, Sweden, Finland, Germany, Poland, Italy, Austria, Hungary, and areas within the Russian Empire are labeled. The map also includes historical regions like Prussia and Moravia.
Emigration Centers: The map is dotted with markers indicating centers of emigration. These markers are denser in certain areas, such as Ireland, Germany, Italy, and regions within the Austro-Hungarian Empire and the Russian Empire, reflecting higher levels of emigration to the United States.
Legends and Charts: There are two pie charts on the map:
- One chart labeled "Total Russian Empire, Fiscal Year 1901-1902" and "Total Austro-Hungarian, 1901-1902" shows the distribution of emigrants from various parts of the Russian Empire and Austro-Hungarian regions.
- Another legend provides details on emigration figures for specific regions.
Map Design: The map employs a simple design with clear labels and dots to indicate emigration centers. It's a historical record, reflecting the migration patterns of the early 20th century.
Overall, the map serves as a visual representation of migration flows from Europe to the United States, highlighting specific areas of significant emigration during the fiscal year 1902.
Anthropic Claude
Created by anthropic.claude-3-haiku-20240307-v1:0 on 2025-06-15
This image appears to be a map depicting the "Centres of European Emigration to the United States" during the fiscal year 1902. The map shows the countries and regions of Europe, with various symbols and data points indicating the centers or origins of emigration to the United States at that time. The map provides a visual representation of the patterns and flows of European migration to the United States in the early 20th century.
Created by us.anthropic.claude-3-5-sonnet-20241022-v2:0 on 2025-06-15
This is a historical map titled "Centres of European Emigration to the United States" from the fiscal year 1902. The map shows various regions of Europe, including Russia, Germany, France, Spain, Italy, Austria-Hungary, and other countries. Small dots appear to indicate areas of high emigration, with particularly dense clusters visible in certain regions, especially in Eastern Europe and around the Mediterranean. The map includes the Atlantic Ocean, North Sea, Baltic Sea, Black Sea, and Mediterranean Sea. There are also what appear to be statistical charts or legends on the side of the map showing emigration data. The map is rendered in black and white and has a simple, clean design typical of early 20th-century cartography.
Meta Llama
Created by us.meta.llama3-2-11b-instruct-v1:0 on 2025-06-11
The image depicts a map of Europe, specifically the regions of the United States, titled "CENTRES OF European Emigration to the UNITED STATES." The map is dated 1902 and provides information on the number of emigrants from various European countries who arrived in the United States during that year.
Map Features:
- The map features a beige background with black lines and text.
- The title is located in the top-left corner, with the subtitle "FOR THE FISCAL YEAR 1902" written below it.
- The map includes the names of several European countries, including Germany, Austria, Hungary, Russia, and others.
- Each country is marked with a series of dots, which represent the number of emigrants who arrived in the United States from that country during the fiscal year 1902.
- A key or legend is provided in the top-right corner, which explains the meaning of the dots and the numbers associated with each country.
- The map also includes a compass rose in the bottom-left corner, which indicates the direction of north.
Emigration Data:
- The map provides data on the number of emigrants from each European country who arrived in the United States during the fiscal year 1902.
- The data is presented in the form of dots, with the size and density of the dots indicating the number of emigrants from each country.
- The key or legend explains the meaning of the dots and the numbers associated with each country.
- The data shows that the majority of emigrants came from Germany, followed by Austria-Hungary and Russia.
Conclusion:
The map provides a visual representation of the emigration patterns from Europe to the United States in 1902. It highlights the significant number of emigrants from Germany, Austria-Hungary, and Russia, and provides a detailed breakdown of the data for each country. The map is a valuable resource for understanding the historical context of immigration to the United States during this period.
Created by us.meta.llama3-2-90b-instruct-v1:0 on 2025-06-11
The image presents a map of Europe, titled "CENTRES OF European Emigration to the UNITED STATES." The map is dated for the fiscal year 1902 and features a beige background with black text and lines. It includes various countries, seas, and bodies of water, as well as several symbols and markings.
Key Features:
- Title: "CENTRES OF European Emigration to the UNITED STATES."
- Date: Fiscal year 1902
- Background: Beige
- Text and Lines: Black
- Countries, Seas, and Bodies of Water: Various countries, seas, and bodies of water are depicted on the map.
- Symbols and Markings: Several symbols and markings are present on the map, including dots, lines, and other shapes.
Overall Impression:
The image appears to be a historical map showing the centers of European emigration to the United States in 1902. The map provides a visual representation of the migration patterns and trends during that time period.
Amazon Nova
Created by amazon.nova-lite-v1:0 on 2025-06-05
The image is a map of Europe from the year 1902, titled "Centres of European Emigration to the United States for the Fiscal Year 1902." The map depicts various countries in Europe, including Germany, France, Italy, and others, with dots representing the centers of emigration to the United States. The map also includes a compass rose and a scale in the upper right corner, as well as a legend in the lower right corner that provides information about the different types of data represented on the map. The map is a historical document that provides insight into the patterns of European emigration to the United States during the early 20th century.
Created by amazon.nova-pro-v1:0 on 2025-06-05
The image is a map of Europe, with the title "Centres of European Emigration to the United States for the Fiscal Year 1902" at the top left. The map is divided into different countries, with each country labeled with its name. The countries are colored in different shades, with some having dots or circles on them. The map also includes a legend on the right side, which explains the meaning of the different colors and symbols used on the map.
Google Gemini
Created by gemini-2.0-flash-lite on 2025-06-01
This is a historical map titled "Centres of European Emigration to the United States" for the fiscal year 1902. It shows the source locations of European emigration, with the dots and pie charts representing the number of emigrants.
Here's a breakdown:
- Geographical Scope: The map covers Europe and parts of Asia, with the focus on countries that were major sources of emigration to the United States.
- Visual Representation:
- Dots: The dots on the map seem to denote the major centers of emigration. Density suggests the concentration of emigration from that area.
- Pie Charts: Pie charts are used to provide a breakdown of emigration by specific regions or ethnic groups. Each slice of the pie represents a different origin.
- Labels: Country names are prominently displayed, as well as bodies of water.
- Data & Categories: The map includes statistics, potentially organized by region and ethnicity.
- Overall Impression: The map is a snapshot of European emigration to the US at the beginning of the 20th century, providing insights into the demographic trends of that period.
Created by gemini-2.0-flash on 2025-06-01
Here's a description of the image based on the provided information:
Overall:
The image is a map of Europe showing "Centres of European Emigration to the United States" for the fiscal year 1902. The map is rendered in a simple, black and white style. It includes the general outline of Europe's geography and the adjacent parts of Africa and Asia.
Key Features:
Title and Date: The title, "Centres of European Emigration to the United States," and the year, 1902, are prominently displayed at the top left of the map.
Geographical Boundaries: The map shows the borders of various countries in Europe at that time.
Emigration "Centers": The map uses dots and circles concentrated in certain areas to indicate the centers of emigration. Some specific numbers are given around these areas (for example, dots in Ireland and England have numbers next to them). The density of these dots appears to correlate with the relative number of emigrants.
Pie Charts and Data Tables: Several small pie charts are positioned over key countries/regions (e.g. Italy, Austria-Hungary, Germany, and Russia), along with small tables specifying total numbers of emigrants and their ethnic groups.
Surrounding Oceans and Seas: The map labels the Atlantic Ocean, North Sea, Irish Sea, Baltic Sea, Black Sea, and Mediterranean Sea.
Country Labels: Major countries are labeled, including Scotland, England, France, Spain, Portugal, Germany, Austria-Hungary, Italy, Serbia, Bulgaria, Turkey, Russia, Norway, Sweden, and Finland.
Overall Impression:
The map is a visual representation of the origins of European immigrants to the United States in 1902. It highlights specific regions and countries that were major sources of emigration, providing a snapshot of migration patterns at that time.
Mistral Pixtral
Created by us.mistral.pixtral-large-2502-v1:0 on 2025-06-05
The image is a historical map titled "Centres of European Emigration to the United States for the Fiscal Year 1902." It illustrates the primary regions in Europe from which people emigrated to the United States during that year. The map is marked with dots to indicate the density of emigration from various regions. Here is a detailed summary:
Title and Year: The map is focused on European emigration to the United States for the fiscal year 1902.
Geographic Coverage: The map covers most of Europe, including parts of Western Europe, Central Europe, Eastern Europe, and Northern Europe. It extends from the Atlantic Ocean in the west to parts of Russia in the east and from the North Sea and Baltic Sea in the north to the Mediterranean Sea in the south.
Emigration Centers:
- High Density Areas:
- Austria-Hungary: The regions of Galicia and Hungary are heavily dotted, indicating significant emigration from these areas.
- Italy: Southern Italy and Sicily show a high concentration of dots, suggesting substantial emigration from these regions.
- Moderate Density Areas:
- Germany: Various regions within Germany have moderate dot density.
- Russia: Several regions, particularly in the western part of Russia, show moderate emigration levels.
- Sweden and Norway: These countries also have moderate dot densities.
- Low Density Areas:
- United Kingdom (England, Ireland, Scotland): The map shows some emigration but at a lower density compared to other regions.
- France, Spain, and Portugal: These countries have relatively fewer dots, indicating lower emigration levels.
- High Density Areas:
Pie Charts and Tables:
- There are pie charts and tables included on the map that provide additional statistical data about the emigration figures. These likely break down the numbers of emigrants by country or region, but the specific details are not fully legible in the image.
Surrounding Seas and Oceans: The map includes the surrounding bodies of water such as the Atlantic Ocean, North Sea, Baltic Sea, Mediterranean Sea, and Black Sea, providing geographical context.
Overall, the map provides a visual representation of the primary sources of European emigration to the United States in 1902, highlighting areas with higher and lower levels of emigration through the use of dots.