
Machine Generated Data
Tags
Amazon
created on 2019-06-05
| Text | 99.6 | |
|
| ||
| Calendar | 83.7 | |
|
| ||
| Tower | 72.8 | |
|
| ||
| Clock Tower | 72.8 | |
|
| ||
| Architecture | 72.8 | |
|
| ||
| Building | 72.8 | |
|
| ||
| Page | 56.1 | |
|
| ||
Clarifai
created on 2019-06-05
Imagga
created on 2019-06-05
Microsoft
created on 2019-06-05
| screenshot | 85 | |
|
| ||
| font | 84.8 | |
|
| ||
| text | 75.3 | |
|
| ||
| typography | 75.1 | |
|
| ||
| handwriting | 73.3 | |
|
| ||
| design | 70.5 | |
|
| ||
| number | 69.1 | |
|
| ||
| square | 15.4 | |
|
| ||
Color Analysis
Feature analysis
Amazon
Clock Tower
| Clock Tower | 72.8% | |
|
| ||
Categories
Imagga
| text visuals | 52.2% | |
|
| ||
| paintings art | 46.5% | |
|
| ||
Captions
Microsoft
created on 2019-06-05
| a black sign with white text | 86.4% | |
|
| ||
| a white sign with black text | 86.3% | |
|
| ||
| a black sign with white letters | 83.4% | |
|
| ||
Text analysis
Amazon

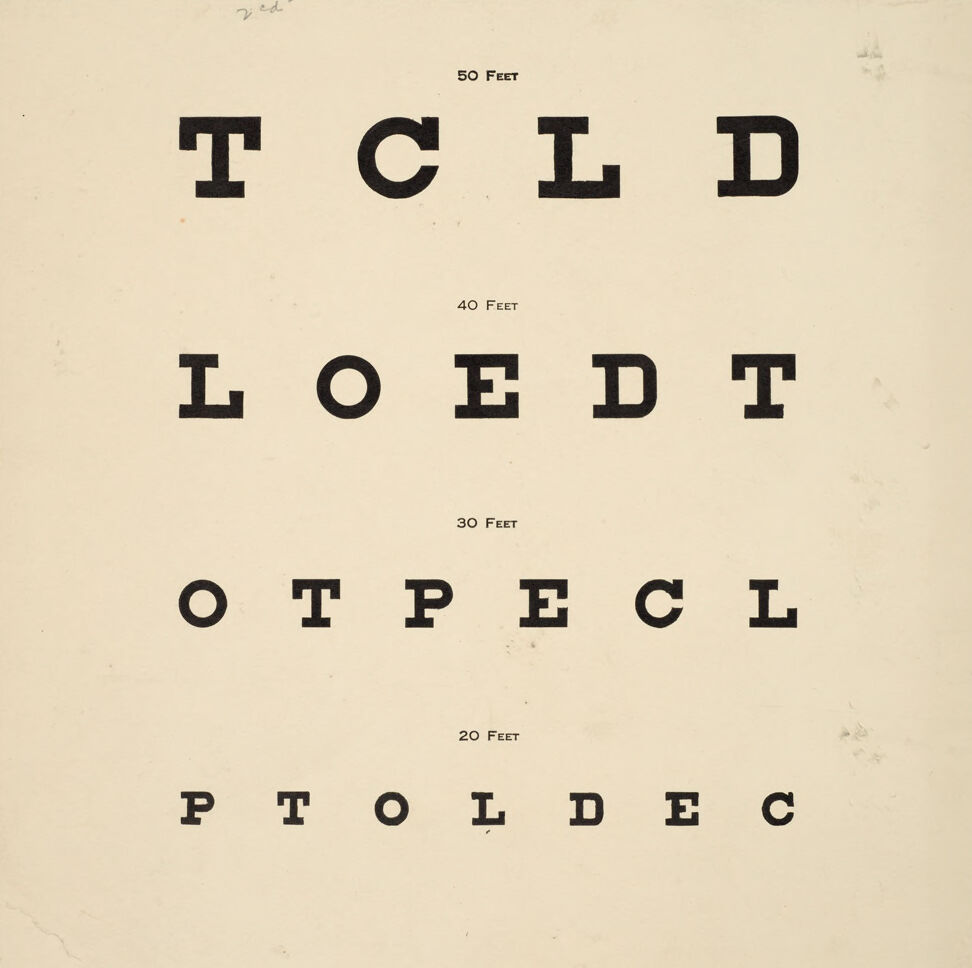
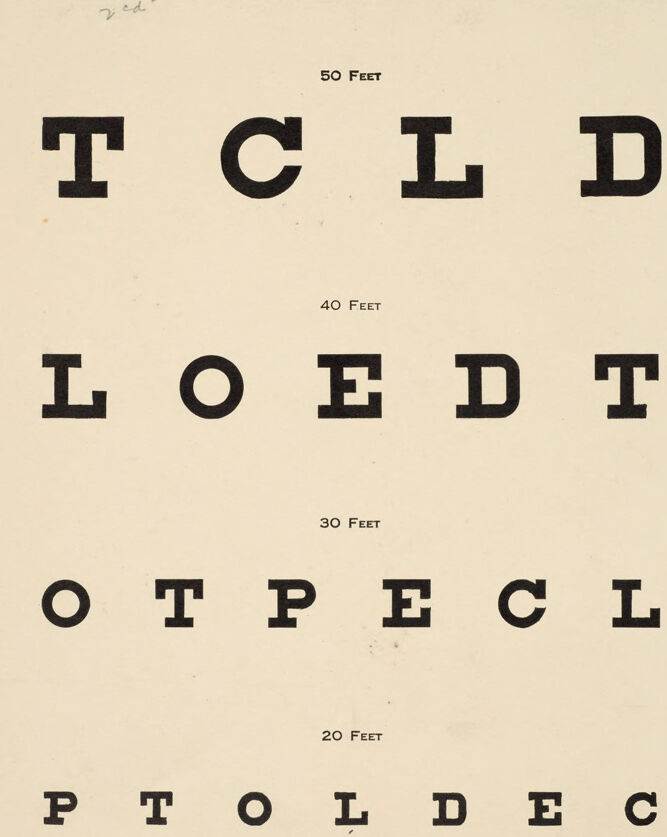
OTPECL

PTOLDEC

FEET

30 FEET

40 FEET

20

30

40

D

50 FEET

TCLD D

LOFDT

20 FEET

50

TCLD
ed
50 FEET
T C L D
40 FEET
L O E D T
30 FEET
O T PE C L
20 FEET
D EC
P T OL

ed

50

FEET

T

C

L

D

40

O

E

30

PE

20

EC

P

OL