
Machine Generated Data
Tags
Color Analysis
Feature analysis
Amazon
Clarifai
AWS Rekognition
| Rug | 71.9% | |

Categories
Imagga
created on 2018-04-18
| paintings art | 79.1% | |
| text visuals | 9.6% | |
| streetview architecture | 7.5% | |
| interior objects | 2.8% | |
| cars vehicles | 0.3% | |
| macro flowers | 0.2% | |
| food drinks | 0.2% | |
| nature landscape | 0.1% | |
| events parties | 0.1% | |
Captions
Microsoft
created by unknown on 2018-04-18
| a close up of a clock | 12.6% | |
| a clock mounted to it | 11.3% | |
| close up of a clock | 9.2% | |
Clarifai
No captions written
Salesforce
Created by general-english-image-caption-blip on 2025-05-12
a photograph of a picture of a colorful colored line drawing of a rainbow - colored line
Created by general-english-image-caption-blip-2 on 2025-06-29
a black and white image of a rainbow colored square
OpenAI GPT
Created by gpt-4o-2024-05-13 on 2024-12-30
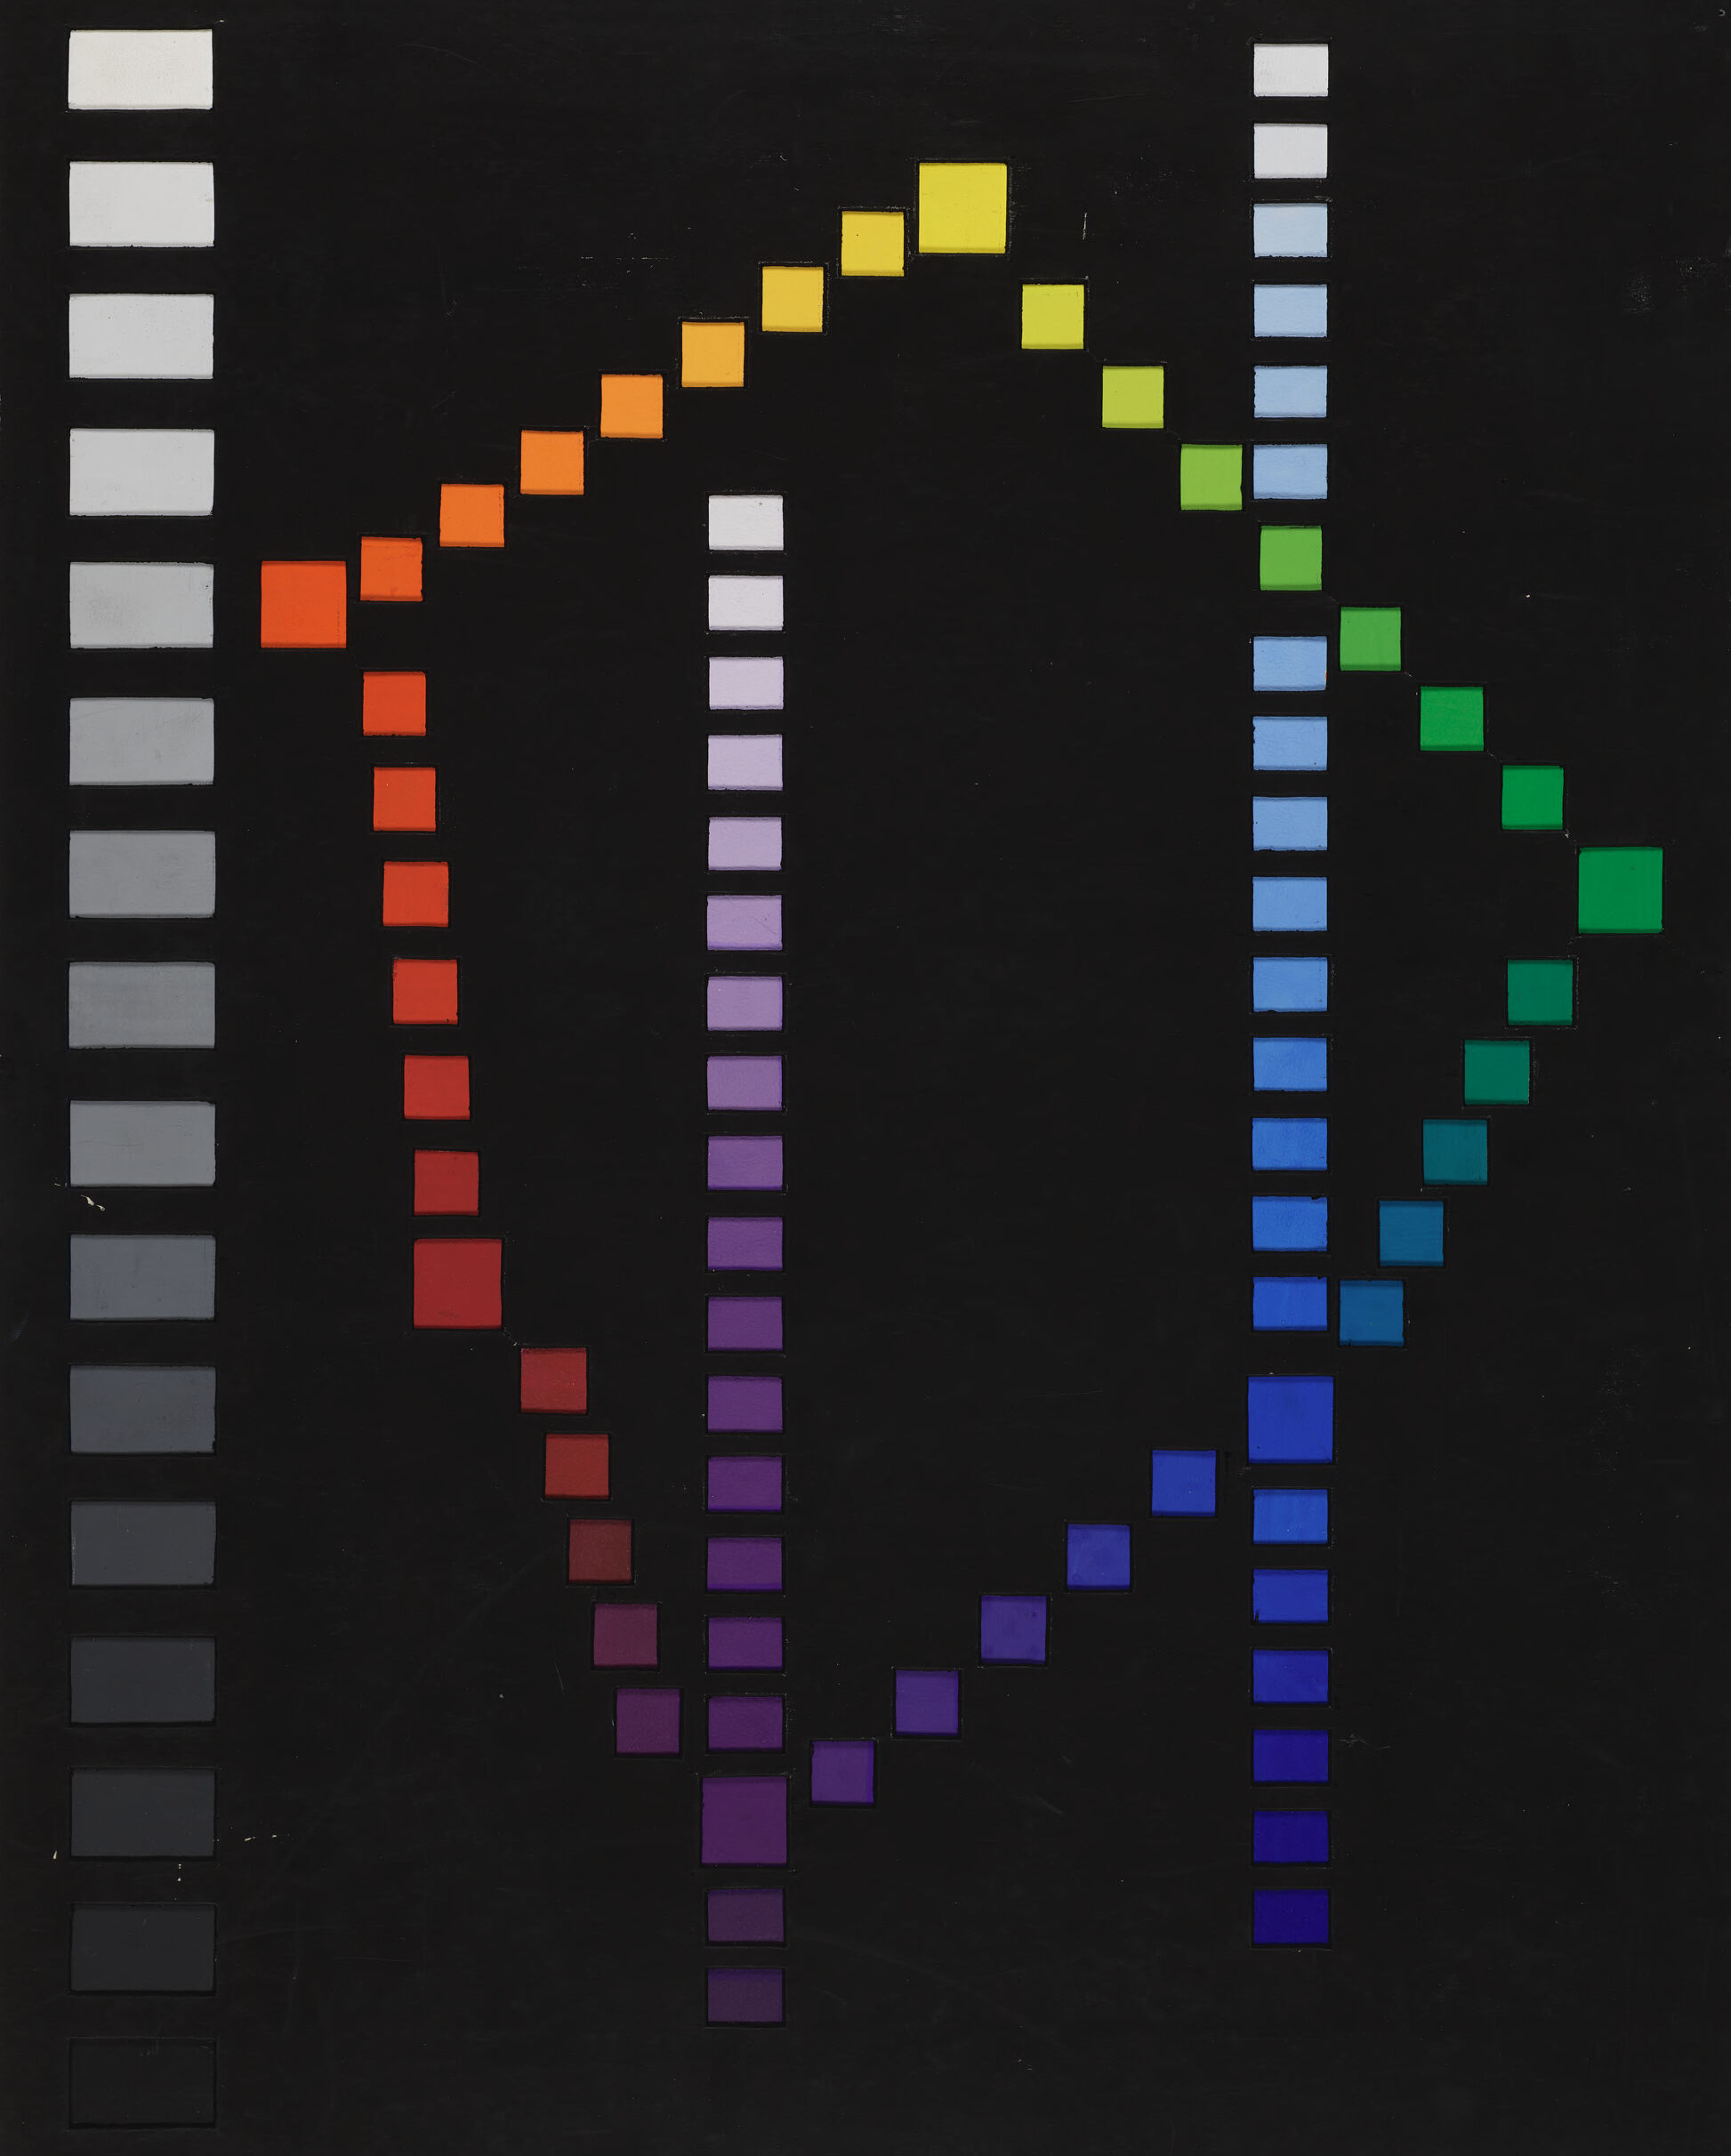
The image depicts an abstract composition featuring a series of colored squares arranged on a black background. The squares form lines that intersect and create geometric shapes.
On the left side, there's a vertical column of grayscale squares from white to black. In the middle and to the right, several columns of colored squares span the range of the visible spectrum: red, orange, yellow, green, blue, and purple. The colored squares are arranged to form several interconnected diagonal patterns, creating an aesthetically pleasing and vibrant design.
Created by gpt-4 on 2024-11-17
This image features a pixelated representation of a cup (most likely a coffee mug) made up of squares in a variety of colors. The colors form a gradient, starting with red at the bottom left side, transitioning to orange, yellow, lime green, green, and then shades of blue as the "liquid" reaches the top right side of the cup. Alongside both the left and the right edges of the image, there are vertical columns of smaller squares displaying grayscale tones; the left one goes from white to black and the right one also goes from white to black, both serving as gradients. The background is solid black, contrasting with the colorful geometric shapes that compose the mug.
Anthropic Claude
Created by us.anthropic.claude-3-5-sonnet-20241022-v2:0 on 2025-06-25
This appears to be an abstract geometric composition on a black background. The image consists of several vertical columns of colored squares and rectangles. On the left side, there's a column of gray rectangles. Moving right, there are columns of squares that transition through different colors in a rainbow-like progression: red/orange squares that angle upward, purple squares in the middle, and blue/green squares toward the right side. The squares appear to create diagonal patterns across the composition, with warmer colors (reds, oranges, yellows) transitioning to cooler colors (blues, greens). The arrangement suggests movement or flow, somewhat like a musical score or data visualization. The contrast between the colored squares and the black background creates a striking visual effect.
Created by claude-3-5-sonnet-20241022 on 2024-12-27
This appears to be an abstract geometric artwork featuring columns of colored squares arranged on a black background. The squares follow a gradient pattern, transitioning through different colors including grey, red, orange, yellow, green, and blue. The arrangement creates a dynamic visual rhythm, with the columns varying in height and position, creating a wave-like or serpentine pattern across the composition. The style is reminiscent of modernist abstract art, particularly color theory studies and minimalist design from the mid-20th century. The systematic arrangement of colors suggests this might be a study of color relationships or a visualization of some form of data or musical notation.
Created by claude-3-haiku-20240307 on 2024-11-17
The image appears to be a color spectrum or palette, displaying a gradient of different colors arranged vertically. The colors range from warm tones like yellow and orange at the top, transitioning through the spectrum to cooler tones of blue and green at the bottom, against a black background. The colors are presented in abstract square shapes, creating a visually striking and geometric composition.
Meta Llama
Created by us.meta.llama3-2-90b-instruct-v1:0 on 2024-12-24
This image presents a vibrant color palette, comprising 7 distinct colors, each represented by a range of shades. The colors are arranged in a specific order, with white at the top left, followed by gray, red, purple, blue, green, and yellow.
The color palette is organized in a way that each color transitions smoothly into the next, creating a visually appealing gradient effect. The background of the image is a solid black, which helps to accentuate the colors and make them stand out.
Overall, the image appears to be a tool for designers, artists, or anyone looking to explore different color combinations and palettes. It provides a clear and concise way to visualize how different colors interact with each other and can be used to create a wide range of effects.
Created by us.meta.llama3-2-11b-instruct-v1:0 on 2024-11-29
The image presents a color chart featuring a range of colors, with the primary colors (red, orange, yellow, green, blue, and purple) displayed in the center. The colors are arranged in a gradient-like pattern, transitioning from light to dark shades.
Color Chart Details:
- Color Range: The chart includes a variety of colors, including white, gray, black, and various shades of the primary colors.
- Color Arrangement: The colors are arranged in a gradient-like pattern, with the lightest shades on the left and the darkest shades on the right.
- Color Intensity: The colors gradually transition from light to dark, with the lightest shades appearing on the left side of the chart and the darkest shades appearing on the right side.
- Color Distribution: The colors are distributed throughout the chart, with some colors appearing more frequently than others.
Key Features:
- Primary Colors: The primary colors (red, orange, yellow, green, blue, and purple) are displayed in the center of the chart.
- Color Gradient: The colors are arranged in a gradient-like pattern, transitioning from light to dark shades.
- Color Distribution: The colors are distributed throughout the chart, with some colors appearing more frequently than others.
Conclusion:
The image presents a comprehensive color chart featuring a range of colors, including white, gray, black, and various shades of the primary colors. The colors are arranged in a gradient-like pattern, transitioning from light to dark shades, and are distributed throughout the chart. The primary colors are displayed in the center of the chart, and the colors are arranged in a way that creates a visually appealing and informative display.
Amazon Nova
Created by amazon.nova-pro-v1:0 on 2025-01-12
The image features a black background with a geometric pattern in the center. The pattern is made up of various colored squares, each with a different shade. The squares are arranged in a specific order, forming a pattern that resembles a letter "P." The colors used in the pattern are red, orange, yellow, green, blue, and purple. The squares are arranged in a way that creates a sense of depth and dimension.
Created by amazon.nova-lite-v1:0 on 2025-01-12
The image features a colorful and intricate design on a black background. The design consists of various colored squares and rectangles arranged in a grid-like pattern. The colors used in the design include white, yellow, orange, red, purple, blue, green, and black. The design appears to be a visual representation of a color spectrum, with the colors transitioning smoothly from one to another. The image has a modern and artistic feel, and it could be used for various purposes, such as a poster, a wallpaper, or a digital artwork.
Google Gemini
Created by gemini-2.0-flash on 2025-05-29
The image is an abstract composition on a black background, featuring geometric shapes and a gradient color palette. On the left side, there is a vertical column of rectangular blocks, ranging in shade from white at the top to near-black at the bottom, forming a grayscale gradient.
In the center of the image, a diamond-like shape is constructed from small, square blocks arranged in a gradient from red to yellow, then green to blue. This shape is incomplete and suggests a color spectrum or transition.
Between the grayscale column and the diamond shape, and to the right of it, there are also vertical columns of square blocks. These columns transition through various shades of purple, white, and blue, each in a distinct gradient. The overall effect is a color study, exploring the relationships between different hues and values in a minimalist and structured format.
Created by gemini-2.0-flash-lite on 2025-05-29
Here's a description of the image:
The image is a modern, abstract composition with a geometric design. It features a dark, likely black, background.
Central to the composition is a shape that resembles a stylized diamond or lozenge. This shape is constructed from a series of small, colorful squares. The colors progress across the spectrum.
To the left of the central shape is a vertical column of rectangular blocks that are in grayscale, running from white to nearly black. Two other vertical columns of light-colored rectangular blocks are spaced around the edges of the central diamond.
The overall impression is a structured, minimalist work that emphasizes color relationships and geometric forms.
Mistral Pixtral
Created by us.mistral.pixtral-large-2502-v1:0 on 2025-06-01
The image depicts a color chart used for calibrating and testing the color accuracy of cameras and scanners. It features a grid of colored squares arranged in a specific pattern against a black background. Here is a detailed breakdown:
Columns of Colors:
- First Column (Leftmost): Contains various shades of gray, ranging from white at the top to black at the bottom.
- Second Column: Features shades of red, transitioning from light red at the top to dark red at the bottom.
- Third Column: Displays shades of purple, moving from light purple at the top to dark purple at the bottom.
- Fourth Column: Contains shades of blue, starting with light blue at the top and ending with dark blue at the bottom.
- Fifth Column: Shows shades of green, beginning with light green at the top and concluding with dark green at the bottom.
- Sixth Column: Includes shades of yellow, ranging from light yellow at the top to dark yellow at the bottom.
- Seventh Column (Rightmost): Similar to the first column, it contains various shades of gray, from white at the top to black at the bottom.
Diagonal Lines of Colors:
- There are diagonal lines of colored squares that intersect the vertical columns. These lines include:
- A line of orange squares.
- A line of yellow squares.
- A line of green squares.
- A line of blue squares.
- A line of purple squares.
- A line of red squares.
- There are diagonal lines of colored squares that intersect the vertical columns. These lines include:
Purpose:
- This type of chart is typically used for color calibration to ensure that the colors captured by a camera or scanner are accurate and consistent. It helps in adjusting the settings to match the actual colors of the objects being photographed or scanned.
The arrangement and variety of colors provide a comprehensive reference for evaluating and correcting color reproduction in digital imaging devices.
Qwen
Created by Qwen/Qwen2.5-VL-7B-Instruct on 2025-07-12
This image appears to be an abstract piece of art featuring a series of square shapes arranged in a grid-like pattern against a black background. The squares are of various colors, including white, shades of gray, and a spectrum of other colors such as yellow, orange, red, purple, blue, green, and teal. The squares are arranged in a way that creates a visually striking contrast with the black background. The overall composition is symmetrical, with a series of vertical columns of squares of increasing size from top to bottom. The image gives an impression of a structured and organized sequence of colors and shapes, possibly representing a color spectrum or an abstract interpretation of a color wheel. The left side of the image has a series of lighter shades from white to dark gray, while the right side features a range of colors from yellow to green and blue, with a few darker shades interspersed.
Created by Qwen/Qwen2.5-VL-72B-Instruct on 2025-07-12
This is an abstract piece of art that appears to be a visual representation of a color gradient or spectrum, likely arranged in a pixelated or mosaic pattern. The artwork is set against a black background, which enhances the vibrancy of the colors.
The image is composed of a series of squares, each filled with a different color, creating a gradient effect. The colors transition from yellow at the top left, through orange, red, purple, blue, green, and back to blue at the bottom right. The transition is not linear but rather in a zigzag pattern, creating a dynamic and visually engaging effect.
On the left side of the image, there is a vertical sequence of gray squares that gradually darken from top to bottom, possibly representing a grayscale gradient. Similarly, on the right side, there is another vertical sequence of squares that transition from white to dark blue, creating a complementary gradient.
The overall composition is symmetrical, with the color gradients mirrored on both sides of the central axis. The use of geometric shapes and a structured layout gives the artwork a modern and minimalist aesthetic.