Machine Generated Data
Tags
Color Analysis
Feature analysis
Amazon
| Rug | 99.8% | |
Categories
Imagga
| interior objects | 99.6% | |
| paintings art | 0.4% | |
Captions
Microsoft
created on 2018-07-31
| a close up of a white building | 60% | |
| a large white building | 51.4% | |
| close up of a white building | 51.3% | |
OpenAI GPT
Created by gpt-4o-2024-05-13 on 2024-12-30
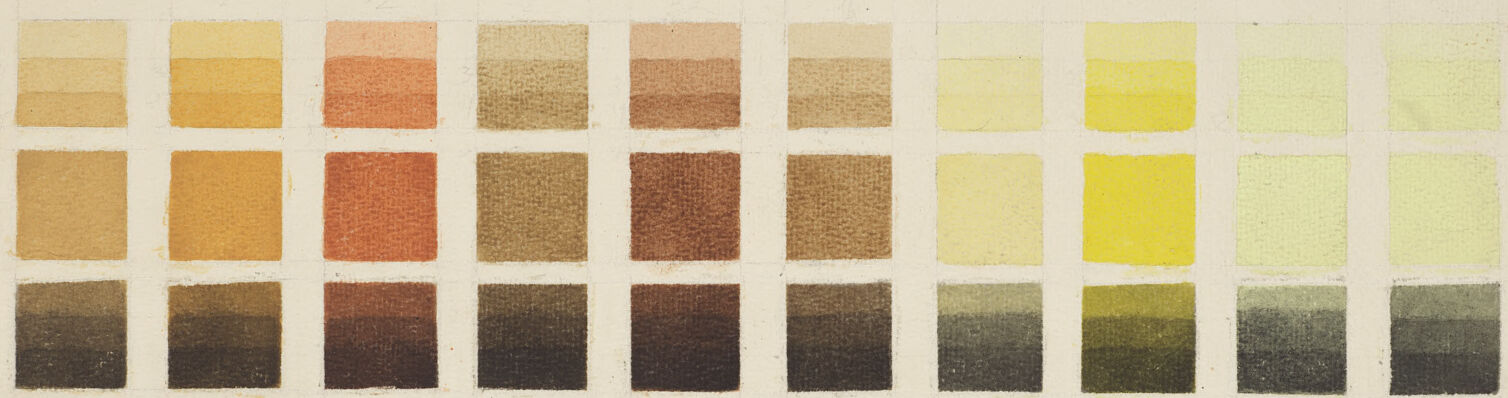
The image depicts a color chart, distinguished by rows and columns of square color swatches. The chart appears to be an organized spectrum of colors, with each row representing different hues and each column showing various shades of a specific hue. The colors transition smoothly from one to another, showcasing a wide range of shades from light to dark. The swatches range from yellow, orange, red, purple, blue, cyan, green, brown, gray, and black. This arrangement allows viewers to see the gradation and variety within each color family. The overall layout is neat and systematic, possibly created for color reference purposes, such as in design or art.
Created by gpt-4 on 2024-11-17
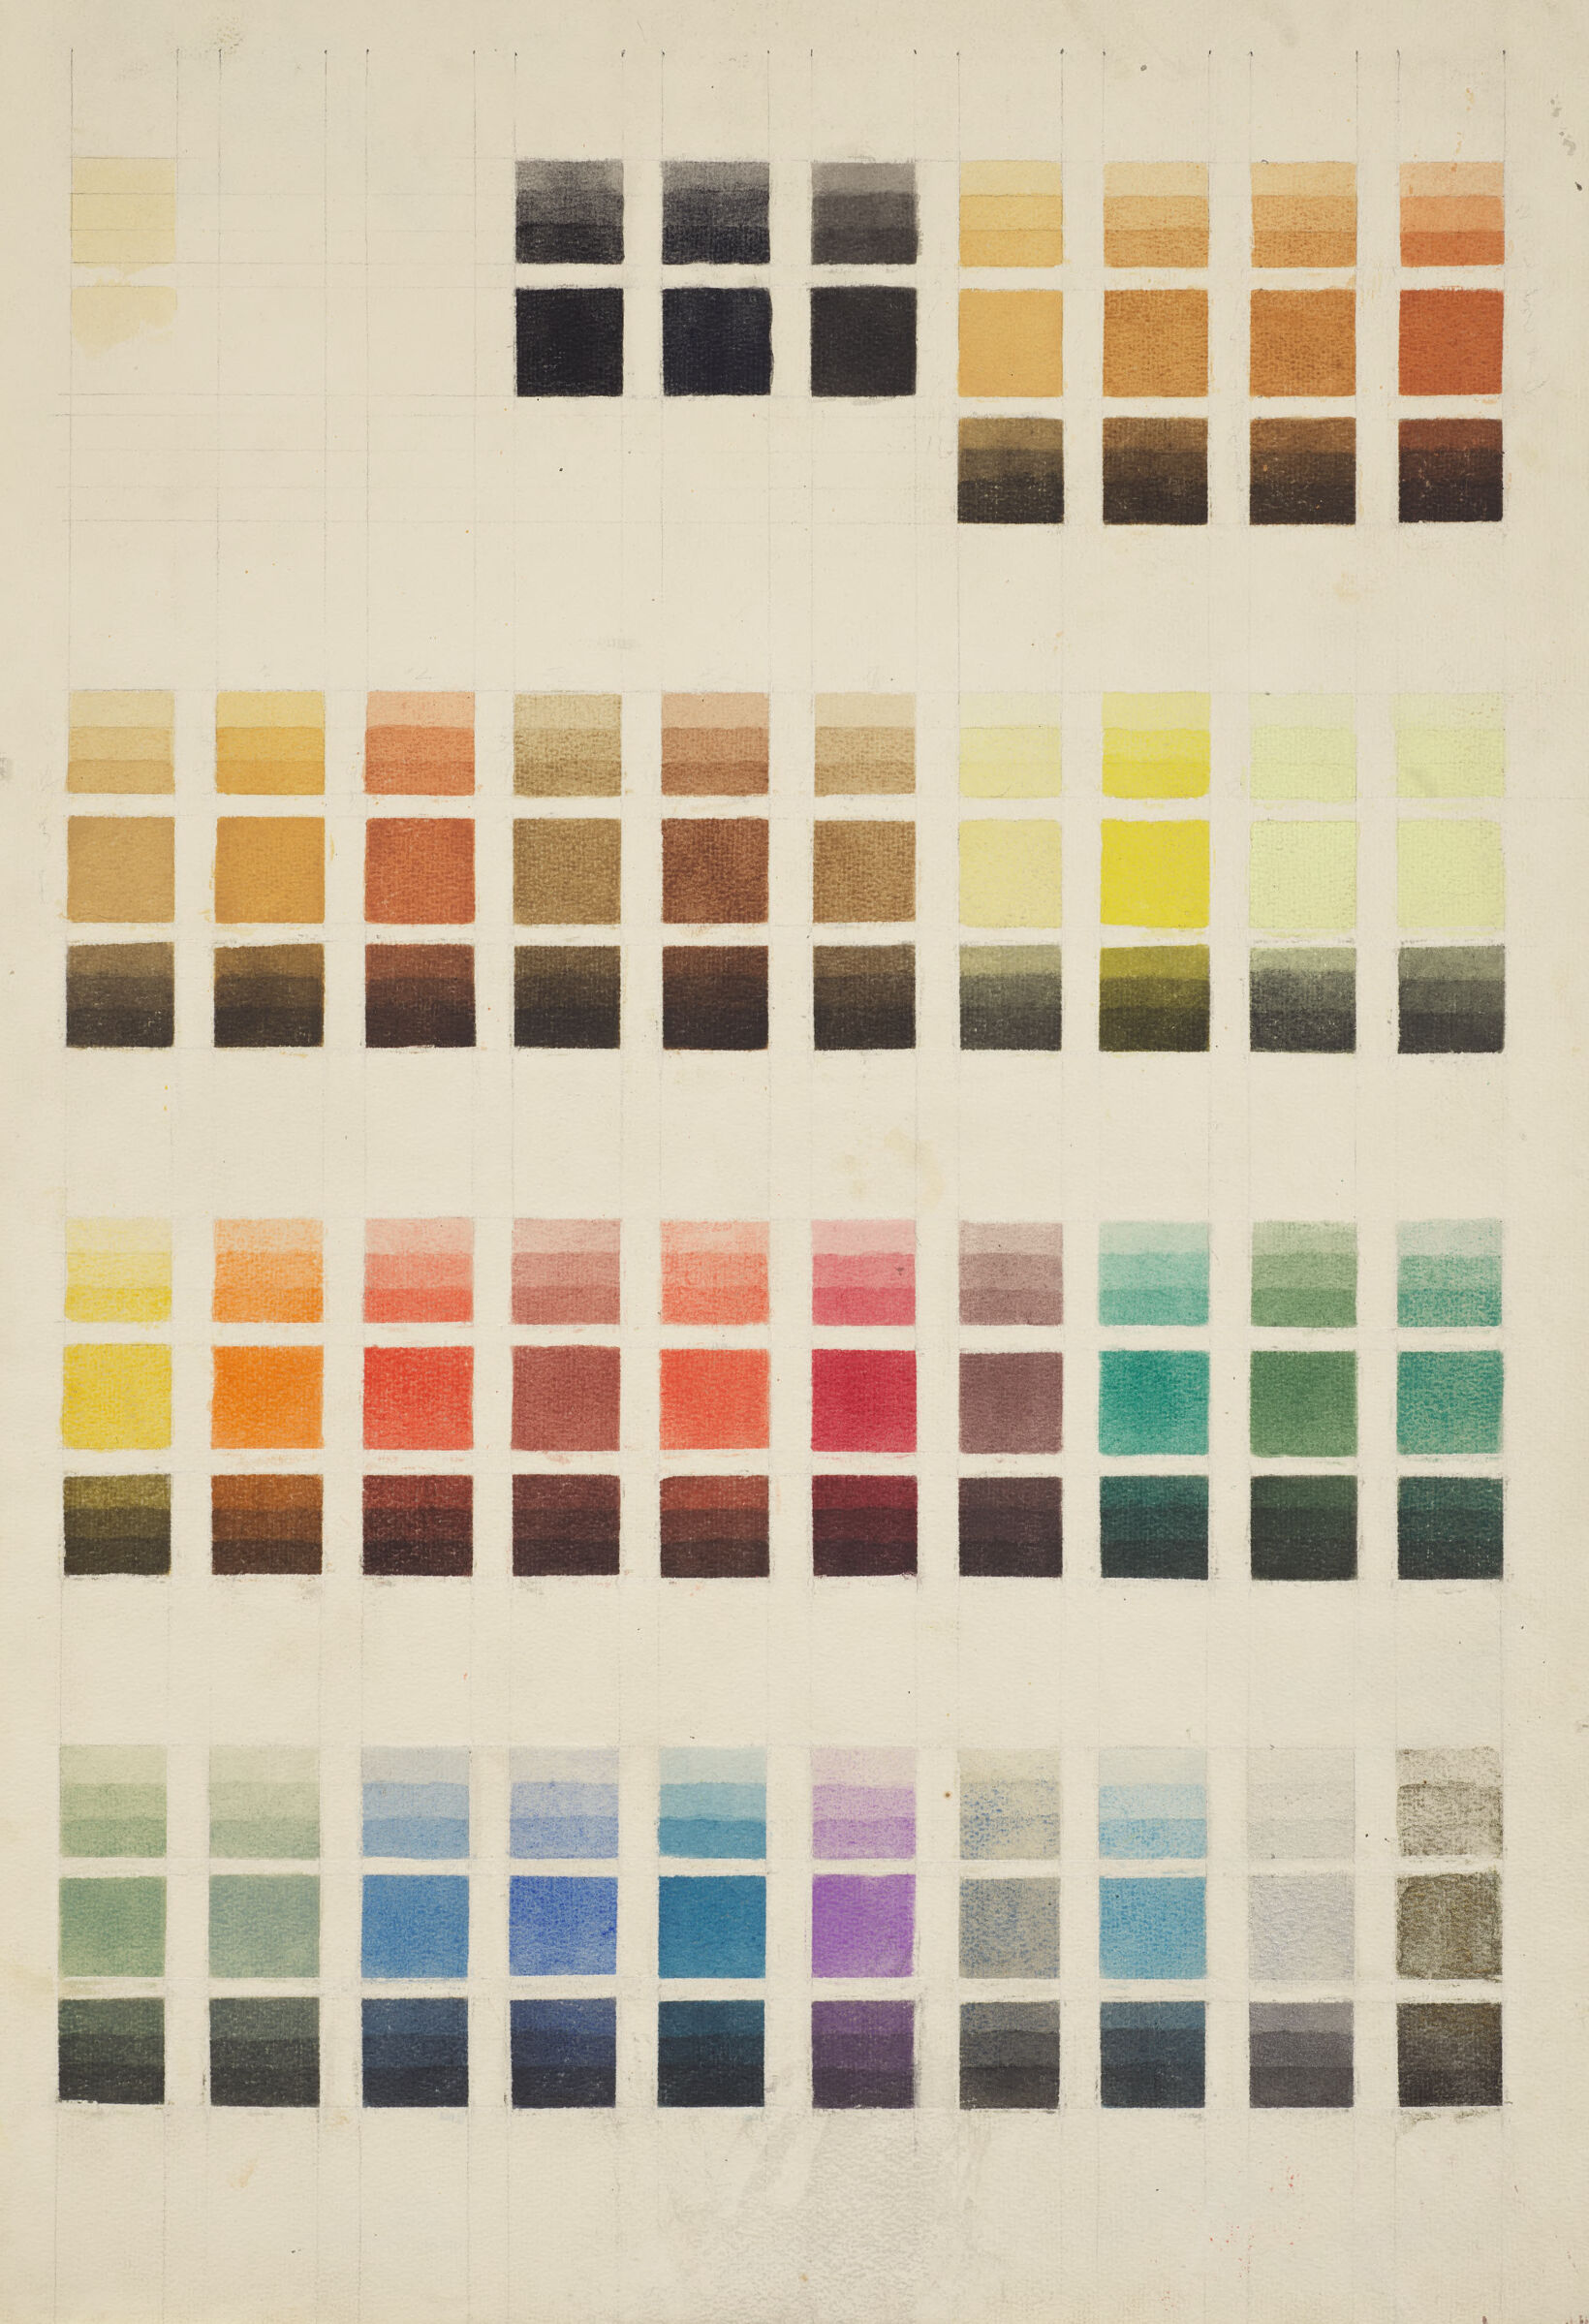
This image shows a piece of artwork with a structured arrangement of color samples. It consists of a large grid of square color patches arranged in rows and columns on a paper or canvas substrate with a visible texture. The grid represents a range of colors that appear to be systematically varied—either by hue, value, or intensity—progressing through different families and tones of colors. The colors seem to be arranged in a way that there might be a logical sequence or gradation from one to the next, possibly starting from neutrals or darks at the top to more vibrant colors as it moves down. The saturation and brightness levels seem varied within each row, with the columns potentially representing a sequence from lighter to darker shades or vice versa. The artist seems to be exploring or documenting a palette, which could be used for reference or study in color theory. The paper's edges appear to be rough and uneven, suggesting that the paper could either be handmade or torn from a larger sheet. The overall look gives an impression of a work in process, meaning that it could be a tool the artist uses to study color rather than a finished piece meant for display.
Anthropic Claude
Created by claude-3-5-sonnet-20241022 on 2024-12-27
This image appears to be a vintage color chart or color palette displaying various color gradients arranged in a grid pattern. Each column shows three shades of the same color, typically moving from lightest at the top to darkest at the bottom. The colors include blacks, browns, oranges, yellows, reds, greens, blues, and purples. It looks like it could be a historical color theory document or an artist's reference guide for color mixing. The image has a slightly aged, cream-colored paper background, suggesting it's from an older time period. The colors are arranged systematically, showing the relationship between different hues and their tonal variations.
Created by claude-3-haiku-20240307 on 2024-11-17
This image appears to be a color swatch or color chart. It contains a grid of rectangular color samples arranged in rows and columns, displaying a wide range of hues and shades from light to dark. The colors span a spectrum from warm yellows and oranges to cool blues and greens, with various earthy tones and neutral shades in between. The overall appearance suggests this is a reference or guide for color selection, likely used for artistic or design purposes.
Meta Llama
Created by us.meta.llama3-2-90b-instruct-v1:0 on 2024-12-24
The image depicts a color chart featuring various shades of colors, arranged in a grid pattern. The chart is divided into sections, each containing a range of colors that transition from light to dark. The colors are displayed in small squares, with each square representing a different shade. The chart appears to be hand-painted, with visible brushstrokes and texture. The colors are muted and earthy, with a focus on browns, greens, blues, and yellows. Some of the colors have a warm, golden tone, while others are cooler and more muted. The background of the chart is a light beige color, which provides a neutral backdrop for the colors. The overall effect is one of subtlety and sophistication, suggesting that the chart may have been created for artistic or design purposes. It's worth noting that the image has a vintage or antique feel to it, with the paper appearing to be aged and worn. This could suggest that the chart is an older document, perhaps from the early 20th century or earlier.
Created by us.meta.llama3-2-11b-instruct-v1:0 on 2024-11-29
The image presents a comprehensive color chart, comprising 12 rows and 8 columns of small squares, each containing a distinct color. The colors are arranged in a gradient-like pattern, transitioning from light to dark within each row, and from left to right across the rows. The colors range from pale pastels to deep, rich hues, including shades of yellow, orange, red, brown, green, blue, and purple. Some of the colors appear to be metallic or iridescent, adding an extra layer of depth and visual interest to the chart. The background of the chart is a warm, off-white color, which provides a subtle contrast to the vibrant colors of the squares. The overall effect is one of complexity and nuance, as the viewer is presented with a vast array of colors that can be mixed and matched to create a wide range of shades and hues. The chart appears to be hand-drawn or painted, with visible brushstrokes and texture adding to its organic feel. The edges of the chart are slightly worn and faded, suggesting that it may have been used extensively over time. Overall, the image is a stunning example of color theory in action, showcasing the infinite possibilities of color and inviting the viewer to explore and experiment with different combinations.
Amazon Nova
Created by amazon.nova-lite-v1:0 on 2025-01-10
The image depicts a watercolor swatch book with a grid-like structure. The book is divided into rows and columns, each containing a square of watercolor paint. The colors range from light to dark shades, with a variety of hues, including yellows, oranges, reds, purples, blues, greens, and browns. The watercolors are applied in a way that shows the gradation of color from light to dark. The book is likely used for color reference or as a tool for artists to mix and match colors.
Created by amazon.nova-pro-v1:0 on 2025-01-10
The image shows a grid of squares with various colors. The grid is divided into four sections, each containing multiple rows and columns of squares. The colors of the squares vary, with some being solid and others having gradients or patterns. The colors range from light to dark shades, including yellow, orange, red, green, blue, and purple. The image appears to be a color palette or a reference for artists to choose colors for their artwork.
Text analysis
Amazon