Machine Generated Data
Tags
Color Analysis
Feature analysis
Amazon
Clarifai
AWS Rekognition
| Rug | 81.1% | |

Categories
Imagga
created on 2018-02-10
| interior objects | 94.9% | |
| paintings art | 4.4% | |
| food drinks | 0.6% | |
| text visuals | 0.1% | |
Captions
Microsoft
created by unknown on 2018-02-10
| a close up of a logo | 60.4% | |
| close up of a logo | 56.9% | |
| a close up of a piece of paper | 42.4% | |
Clarifai
No captions written
Salesforce
Created by general-english-image-caption-blip on 2025-05-12
a photograph of a drawing of a circle of color in a circle
Created by general-english-image-caption-blip-2 on 2025-06-29
a color wheel with red, orange, yellow, green, and black circles
OpenAI GPT
Created by gpt-4o-2024-05-13 on 2024-12-30
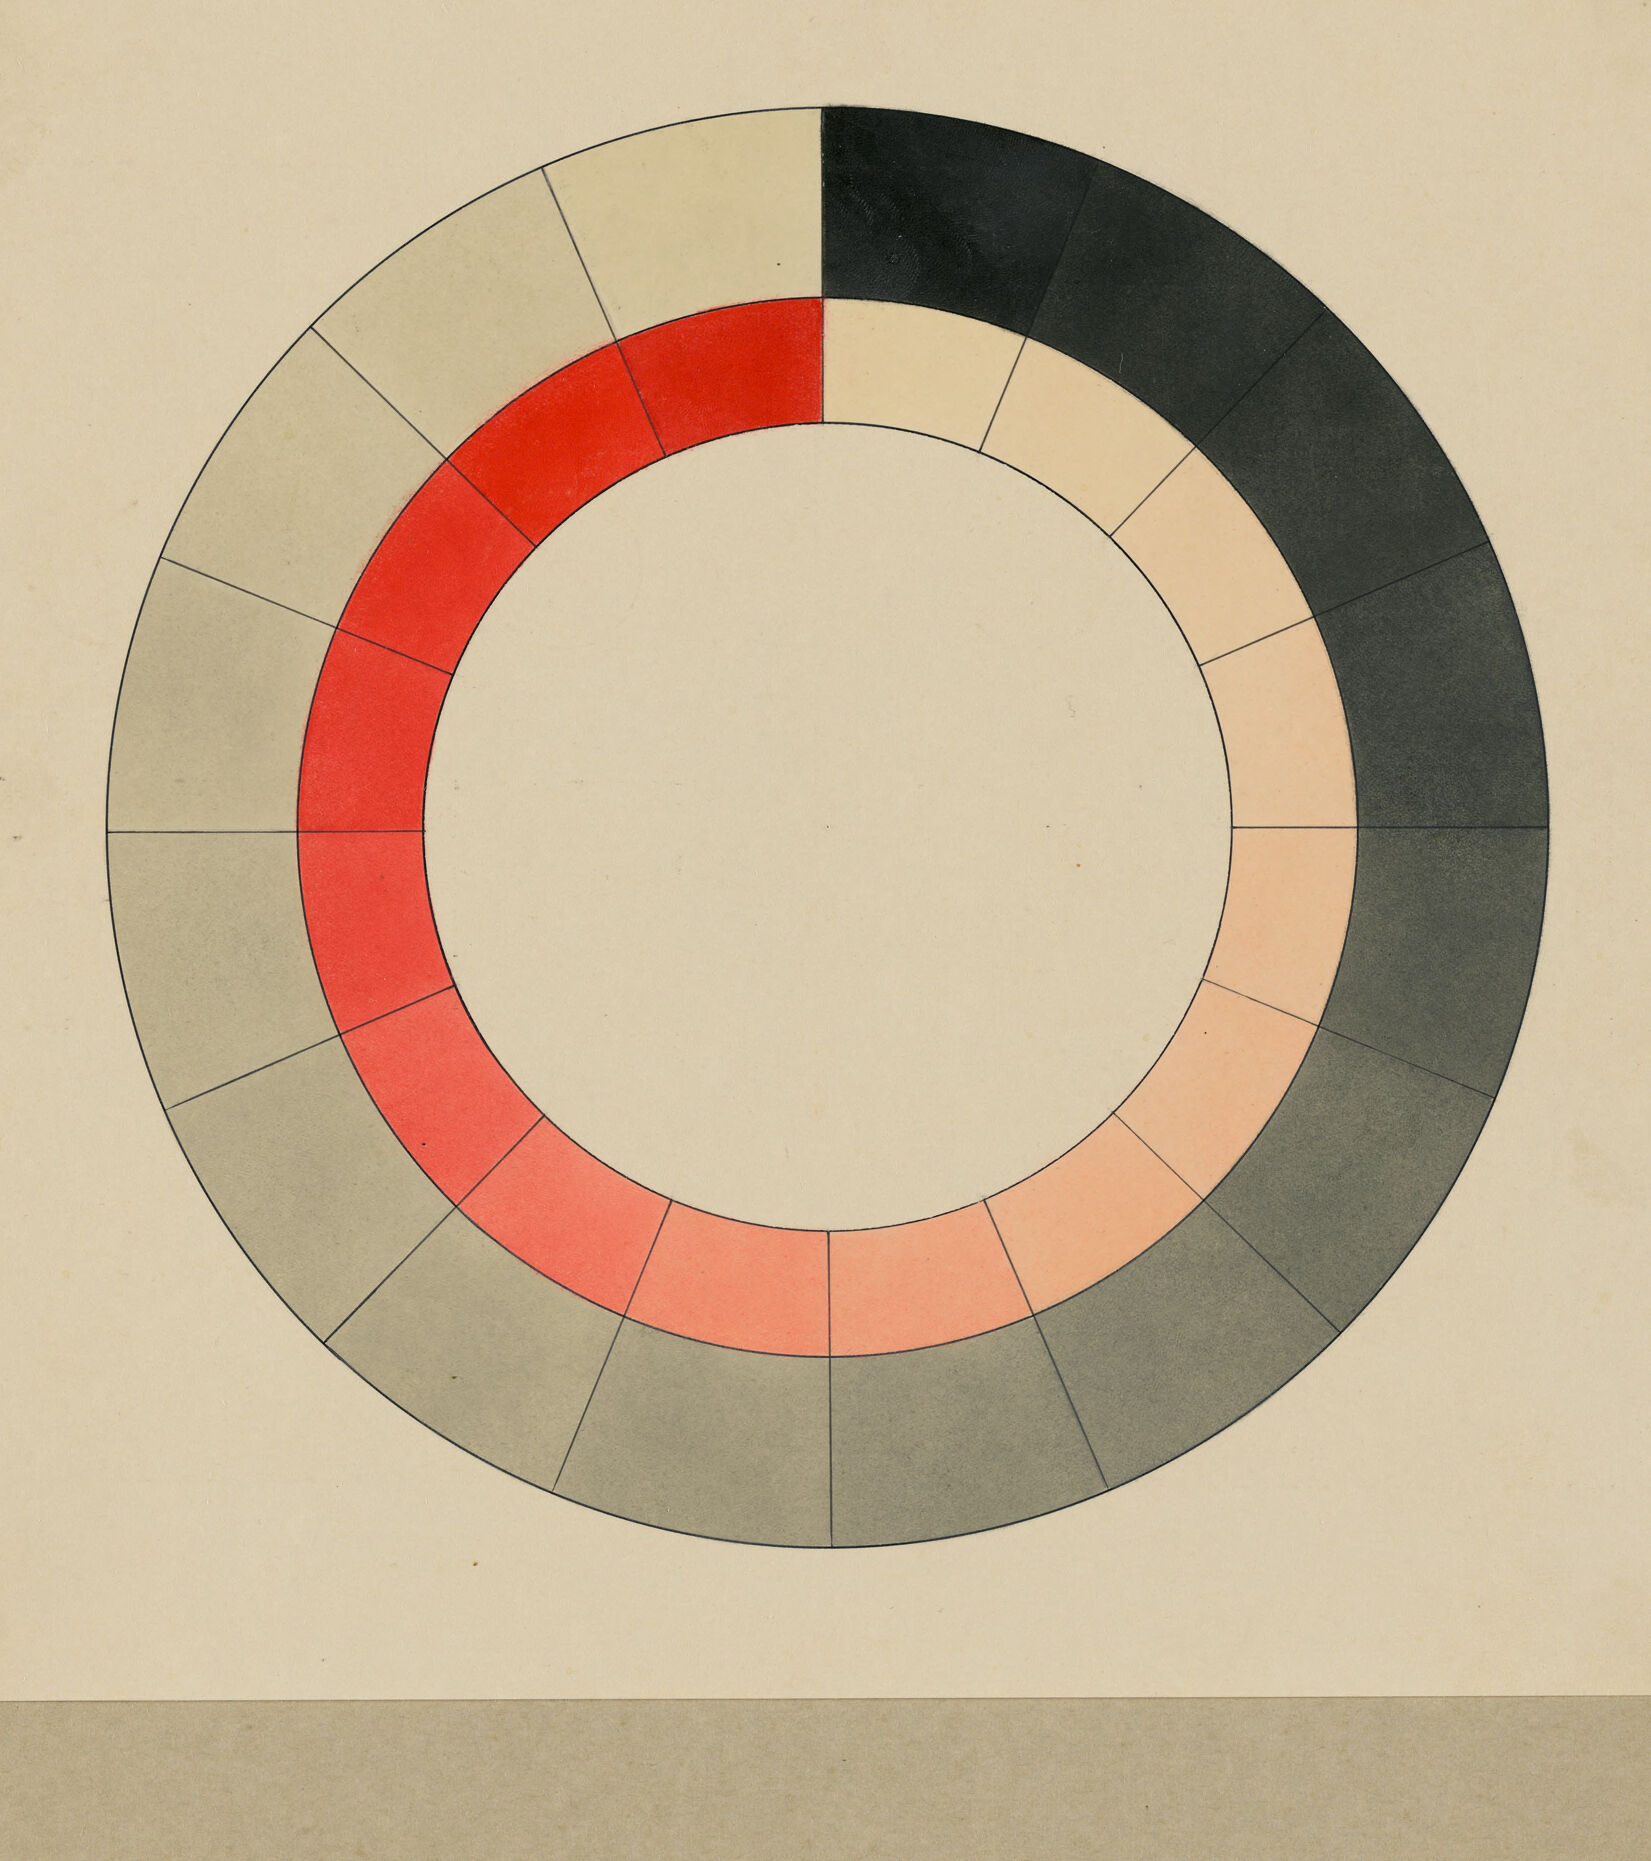
The image shows a circular chart divided into 20 segments, each segment displaying a different shade range, predominantly in the grayscale, red, and green spectrums. The ring starts with dark green shades, transitions to lighter greens and then to a cream color. Moving clockwise, the cream transforms into a coral shade, then darkens to a deep red. The cycle continues with shades darkening back into grayscale.
There is a small piece of handwritten text in German located beneath the circular chart. The text appears to provide details or context for the chart above it. The entire image is mounted on a plain beige background.
Created by gpt-4 on 2024-11-28
The image displays a color wheel or color chart composed of a concentric circular arrangement, segmented into various colored sections. The innermost circle remains blank, surrounded by a ring that is divided into evenly spaced segments, almost resembling a pie chart. Each segment is filled with a different color, transitioning from shades of red to shades of gray and black. Some of the sections are shaded, possibly indicating different tones or saturation levels of the same color.
Below the color wheel, on the beige background, there appears to be a handwritten note in a language that resembles German. The handwriting is in cursive script, making it difficult to read without a clearer image or context. The note is attached to the background with what seems to be an adhesive.
This image has the appearance of being an educational or artistic tool, perhaps used to study color theory, illustrating relationships between colors and possibly the effects of shading or tonal variation. The overall aesthetic suggests it might be a vintage or historical document, given its style and the paper's aged appearance.
Anthropic Claude
Created by us.anthropic.claude-3-5-sonnet-20241022-v2:0 on 2025-06-24
This image shows a circular color wheel or diagram divided into segments. The design features a ring with different colored sections: a prominent red or coral-colored segment, transitioning into lighter peach tones, and then into darker gray or black sections. The segments are evenly spaced and create a complete circle. Below the circular diagram, there appears to be some handwritten text in what looks like German script. The overall composition is set against a light beige or cream-colored background, giving it a vintage or historical document appearance. This type of diagram was often used in early color theory studies or educational materials.
Created by claude-3-5-sonnet-20241022 on 2024-12-26
This image shows a circular color wheel or ring diagram on a light beige background. The ring is divided into segments, with distinct color sections: a bright red section that transitions to lighter pink tones, and a section of dark grey or black that gradually fades to lighter values. The ring appears to be precisely divided into equal segments, creating a smooth gradation between the colors. Below the circular diagram, there appears to be some handwritten text in what looks like German script. The overall composition is minimalist and geometric, suggesting this might be a color theory study or an artistic diagram from a historical document.
Created by claude-3-haiku-20240307 on 2024-11-27
The image appears to be a color wheel or a circular design composed of various shades of red, orange, gray, and black. The design seems to be created using geometric shapes, with each segment representing a different color or tone. There is no identifiable human face or figure in the image.
Meta Llama
Created by us.meta.llama3-2-90b-instruct-v1:0 on 2024-12-24
The image depicts a circular chart with a color gradient, accompanied by a handwritten note in the bottom-left corner. The chart is divided into 16 sections, each featuring a distinct shade of color that transitions from red to black. The colors are arranged in a clockwise direction, starting from the top-right section and moving towards the bottom-left.
The chart is set against a beige background, which provides a neutral contrast to the vibrant colors. In the bottom-left corner, a small piece of paper contains handwritten text in an unknown language. The text appears to be written in cursive script, adding an element of elegance to the overall design.
The image suggests that the chart may be used for educational or artistic purposes, such as teaching color theory or creating a visual representation of a concept. The use of a circular shape and gradual color transition creates a sense of continuity and flow, making the image visually appealing and engaging. Overall, the image presents a unique and thought-provoking visual representation that invites the viewer to explore its meaning and significance.
Created by us.meta.llama3-2-11b-instruct-v1:0 on 2024-11-25
The image presents a circular chart with a color-coded legend, accompanied by a handwritten note in the bottom-left corner. The chart is divided into 12 sections, each representing a different color. The colors are arranged in a specific order, with the first section being red, followed by a gradient of shades from light to dark, and ending with black.
The chart is set against a beige background, which provides a neutral and clean visual contrast to the vibrant colors used in the chart. The handwritten note, written in cursive, is placed in the bottom-left corner of the image and appears to be a caption or description of the chart. Unfortunately, the text is not legible due to its small size and the low resolution of the image.
Overall, the image effectively communicates information through its use of color and visual representation, making it easy to understand and interpret. The inclusion of the handwritten note adds an element of personal touch and context to the image, suggesting that it may be part of a larger project or presentation.
Amazon Nova
Created by amazon.nova-pro-v1:0 on 2025-01-11
The image features a circular design with various colors arranged in a specific pattern. The circle is divided into different sections, each with a distinct color. The colors are arranged in a way that creates a gradient effect, with the colors gradually transitioning from one to another. The colors used in the design are red, orange, yellow, green, blue, and purple. The image appears to be a visual representation of a color theory concept.
Created by amazon.nova-lite-v1:0 on 2025-01-11
The image features a circular color wheel, which is a tool used in art and design to understand color relationships. The color wheel is divided into segments, each representing a different color. The colors are arranged in a gradient from light to dark, with the lighter colors on the outer edge and the darker colors towards the center. The wheel is surrounded by a white border and has a beige background. There is also a small note in German, which translates to "No one who has seen this color wheel has ever seen it again."
Google Gemini
Created by gemini-2.0-flash on 2025-06-04
Here's a description of the image:
The image shows a color wheel diagram, mounted on a light brown/beige background. The diagram itself is circular, made up of concentric rings and radial lines. The radial lines divide the wheel into segments, creating a series of color blocks.
The innermost ring is filled with red, transitioning through shades of red-orange, orange, and peach. Adjacent to each color block in the innermost ring, is a color block of a neutral gray or white tone. Starting from the top, the transition goes from neutral to black.
Below the color wheel, there is a small rectangular card with handwritten text in what appears to be German.
Created by gemini-2.0-flash-lite on 2025-06-04
Here's a description of the image:
The image is a diagram likely related to color theory. It features two concentric circles divided into segments, forming a color wheel.
- Color Wheel: The outer ring of the color wheel displays a range of colors and tones. Starting from the top, the colors progress from light shades, red, and peach, and dark shades.
- Inner Ring: The inner circle appears to be lighter versions of the colors in the outer ring, moving from peach, and light shades.
- Text: A small, rectangular piece of paper is attached below the color wheel. The text is handwritten and appears to be in German. It likely describes the process or concept being demonstrated by the color wheel.
Overall: The image is likely an educational or artistic piece demonstrating the concept of color variations and tonal ranges, possibly for a painting or design.
Mistral Pixtral
Created by us.mistral.pixtral-large-2502-v1:0 on 2025-05-31
The image depicts a color wheel diagram, which is a circular arrangement of colors used to illustrate the relationships between primary, secondary, and tertiary colors. This specific color wheel appears to be divided into segments, with colors transitioning smoothly from one to the next.
Here is a detailed breakdown:
Structure:
- The color wheel is composed of concentric circles.
- The outermost circle contains segments of various colors.
- The inner circles show gradations of these colors, blending into each other.
Colors:
- The top-left segment is red.
- Moving clockwise, the colors transition through shades of pink, light pink, light gray, dark gray, and black.
- The inner circle shows lighter and more muted versions of these colors.
Handwritten Note:
- Below the color wheel, there is a handwritten note in German. The text reads:
Wenn einer solcher Kreise größer wird, dann erscheint der helle Kreis dunkler, und umgekehrt. Ebenso die umgekehrte Erscheinung bei einem dunkleren Hellekreise. Etwas ähnliches und doch anders auszudrücken. - Translated to English, it says:
If one of such circles becomes larger, then
the light circle appears darker, and
vice versa. Similarly, the opposite
appearance with a darker light circle.
Something similar and yet different
to express.
- Below the color wheel, there is a handwritten note in German. The text reads:
Purpose:
- The color wheel and accompanying note seem to be part of a study or explanation of color theory, specifically how the perception of lightness and darkness changes with the size and arrangement of colors.
This image is likely from a scientific or artistic study on color perception and relationships.
Qwen
Created by Qwen/Qwen2.5-VL-7B-Instruct on 2025-07-11
The image depicts a circular color wheel divided into segments, each filled with a different color. The colors range from light to dark shades, including red, pink, gray, and black. The wheel is centered on a beige background, and below it, there is a handwritten note in cursive text. The text appears to be in German and discusses the composition of the color wheel, mentioning the use of black and red to create various tones of gray and white. The note likely provides an explanation or description of the color wheel's design and purpose.
Created by Qwen/Qwen2.5-VL-72B-Instruct on 2025-07-11
The image shows a piece of artwork featuring a circular design with a focus on geometric shapes and color theory. The circle is divided into various sections, each filled with different shades and tones. The colors used include black, red, orange, and various shades of gray and beige. The circle is segmented into triangular and pie-shaped sections, creating a visually striking pattern.
Below the artwork, there is a small handwritten note in German. The text appears to discuss the relationship between colors and light, possibly explaining the principles behind the color wheel depicted in the artwork. The note mentions black and red as opposing colors and discusses different tones and levels of brightness.
The overall composition is minimalistic and abstract, with a focus on the interaction of colors and shapes. The artwork is mounted on a beige background, which complements the colors used in the circle.
Text analysis
Amazon