Machine Generated Data
Tags
Color Analysis
Feature analysis
Amazon
| Rug | 74.1% | |
Categories
Imagga
| text visuals | 98.9% | |
Captions
OpenAI GPT
Created by gpt-4o-2024-05-13 on 2025-02-17
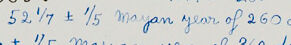
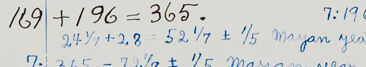
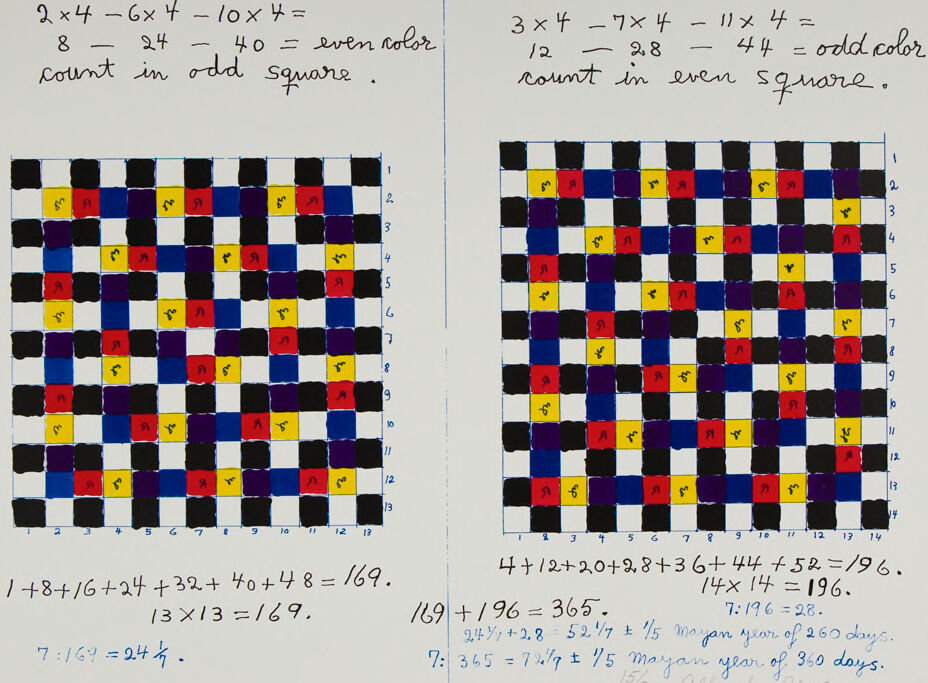
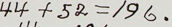
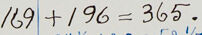
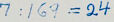
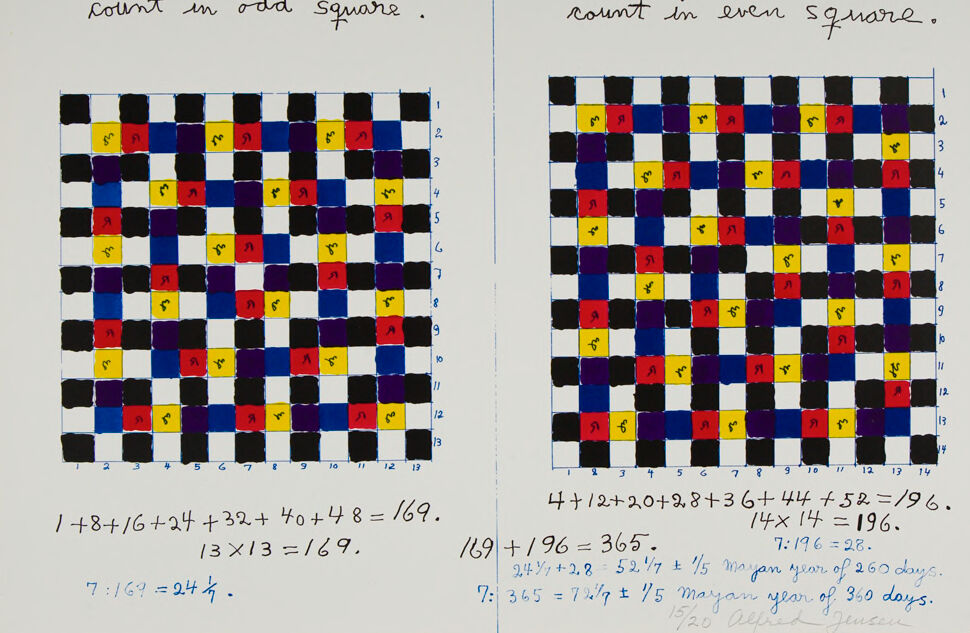
The image consists of two colorful grid patterns, each accompanied by handwritten mathematical calculations and annotations. Each grid pattern is organized in a 13x13 and 14x14 square format, respectively, and consists of individual squares filled with different colors: black, red, yellow, blue, and purple. The squares are arranged in a checkerboard pattern, with numbers written inside some of the colored squares, indicating counts or specific values. The left side of the image features the 13x13 grid. It is accompanied by calculations that sum the products of different sequences of numbers, referring to "even color count in odd squares." On the right side, the 14x14 grid comes with similar calculations, focusing on the "odd color count in even squares." Below both grids, there are additions of sequences, resulting in totals. The left calculations arrive at a total of 169 (13x13), and the right side totals 196 (14x14), which adds up to 365 when combined, highlighted as forming a connection possibly to a calendar year, specifically a reference to Mayan calendar concepts. The annotation in the bottom right mentions "Mayan year of 260 days" and "Mayan year of 360 days," completing the intriguing connection between the patterns and an annual cycle. The name "Alfred Jensen" is written at the bottom right, presumably the creator of the image or author of the notes.
Created by gpt-4 on 2025-02-17
This image shows two hand-drawn and colored grids resembling checkerboards, each with some mathematical equations written on and around them. The grids have alternating colored squares in what appears to be a representation of a mathematical or logical problem, possibly related to patterns or sequences. On the left-hand side, the grid is accompanied by equations that start with "2x4 - 6x4 - 10x4 =", indicating some form of arithmetical progression or pattern analysis. Text above the grid reads "even color count in odd square," perhaps suggesting the pattern pertains to counting occurrences based on color and positional criteria. On the right-hand side, there's a similar set of equations and a grid, with the phrase "odd color count in even square" above it, which seems to imply a mirrored or complementary counting rule to the one on the left. Below each grid are more calculations, possibly summarizing the results of the patterns or rules applied to the grids above them. The completed calculations lead to a number with what seems like an interpretation or conclusion drawn beneath them. There are a few symbols and figures in yellow squares on the grids, although it's not clear from the image what they represent. This artwork or exercise seems to contain elements of mathematics, logic, and possibly a representation of a calendar system, as phrases like "mayan year of 260 days" and "mayan year of 365 days" are written at the bottom right, suggesting that there might be a link to Mayan mathematics or calendars.
Anthropic Claude
Created by claude-3-5-sonnet-20241022 on 2025-02-17
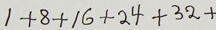
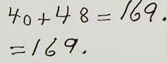
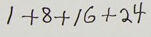
This image shows two checkerboard-style grids with mathematical calculations. Each grid is 13x13 and 14x14 respectively, filled with a pattern of black, white, blue, red, yellow, and purple squares. At the top of each grid are mathematical equations: Left side: 9×4 - 6×4 - 10×4 = 8 - 24 - 40 with a note about "even color count in odd square" Right side: 3×4 - 7×4 - 11×4 = 12 - 28 - 44 with a note about "odd color count in even square" Below the grids are various calculations: Left grid: 1+8+16+24+32+40+48 = 169 (13×13 = 169) Right grid: 4+12+20+28+36+44+52 = 196 (14×14 = 196) The final calculations show: 169 + 196 = 365 With additional notes about "7:169 = 24⅕" and "7:365 = 7⅕ + ⅕" referring to Mayan years of 260 and 360 days. The pattern appears to be related to mathematical and possibly calendar-based calculations using color coding and grid systems.
Created by claude-3-opus-20240229 on 2025-02-17
The image shows two hand-drawn grids filled with colored squares, along with some mathematical equations and notes written alongside each grid. The grid on the left is labeled "9 x 4 - 6 x 4 - 10 x 4 = 8 - 24 - 40 = even color count in odd square". The grid has 13 rows and 13 columns, with most squares colored black, but some are filled with red or yellow. The grid on the right is labeled "3 x 4 - 7 x 4 - 11 x 4 = 12 - 28 - 44 = odd color count in even square". This grid also has 13 rows and 13 columns. The colored squares form a checkerboard-like pattern with red, yellow, and blue. Below each grid, there are handwritten mathematical calculations, likely related to counting the number of days represented by the colored squares in some manner, based on references to "365 days" and "196 days". The handwriting and casual presentation suggests these may be exploratory notes or scratch work capturing someone's thought process as they worked through a mathematical problem or calendar-related analysis using the visual aid of the colored grids.
Created by claude-3-haiku-20240307 on 2025-02-17
The image shows two grids filled with various colored squares, along with handwritten mathematical expressions and calculations. The grids appear to be part of some form of mathematical or logical puzzle. The text accompanying the grids discusses counting the number of odd and even squares in each grid.
Meta Llama
Created by us.meta.llama3-2-11b-instruct-v1:0 on 2025-03-15
The image presents two pages of a notebook, each containing a colorful grid of numbers and mathematical equations. The left page features a 7x7 grid with a mix of black, red, yellow, blue, and purple squares, accompanied by a series of equations that demonstrate the relationship between the colors and the numbers in the grid. **Left Page:** * A 7x7 grid with a mix of black, red, yellow, blue, and purple squares. * A series of equations that demonstrate the relationship between the colors and the numbers in the grid. * The equations include: * 2x4 - 6x4 - 10x4 = 8 - 24 - 40 = even color count in odd square. * 1 + 8 + 16 + 24 + 32 + 40 + 48 = 169. * 13 x 13 = 169. * 7 x 169 = 24 1/2. **Right Page:** * A 7x7 grid with a mix of black, red, yellow, blue, and purple squares. * A series of equations that demonstrate the relationship between the colors and the numbers in the grid. * The equations include: * 3 x 4 - 7 x 4 - 11 x 4 = 12 - 28 - 44 = odd color count in even square. * 4 + 12 + 20 + 28 + 36 + 44 + 52 = 196. * 14 x 14 = 196. * 7 x 196 = 28. * 249 + 2.8 - 52.7 ± 1/5 mayan year of 260 days. * 365 = 74/9 ± 1/5 mayan year of 360 days. The image suggests that the creator of the notebook is exploring the relationship between colors and numbers in a grid, using mathematical equations to demonstrate the connections between the two. The use of different colors and numbers in the grid may represent different variables or values, and the equations may be used to solve for these variables or to demonstrate the relationships between them. Overall, the image appears to be a creative and mathematical exploration of the properties of grids and colors.
Created by us.meta.llama3-2-90b-instruct-v1:0 on 2025-03-15
This image is a page from a notebook or journal, featuring two colorful checkerboard-style diagrams. The left diagram consists of 169 squares, with 13 rows and 13 columns, while the right diagram has 196 squares, arranged in 14 rows and 14 columns. The diagrams are accompanied by handwritten notes and mathematical equations, which appear to be related to the number of even and odd squares in each diagram. The text is written in black ink, with some additional notes in blue ink at the bottom of the page. The background of the page is white, providing a clean and neutral backdrop for the colorful diagrams and handwritten notes. Overall, the image suggests that the creator of the page was engaged in some form of mathematical exploration or problem-solving, using the diagrams as a visual aid to help them understand and analyze the relationships between different numbers and patterns.
Amazon Nova
Created by amazon.nova-pro-v1:0 on 2025-02-17
The image shows a page with two squares, each divided into smaller squares with different colors. The squares are arranged in a grid-like pattern, and each square has a number written on it. The squares are colored in different shades of blue, red, yellow, and black. The numbers on the squares are written in different colors, such as red, blue, and black. The image also has some text written on it, which appears to be mathematical equations or calculations.
Created by amazon.nova-lite-v1:0 on 2025-02-17
The image shows a double-page spread from a book or document featuring mathematical diagrams and equations. On the left side, there is a grid with colored squares, each square is labeled with a number and a letter, possibly representing a mathematical sequence or pattern. The grid is divided into sections with mathematical expressions above and below it. On the right side, there is another similar grid with colored squares, also labeled with numbers and letters. The right side has a complex mathematical equation written on it, involving addition, subtraction, and multiplication. The page has a formal and academic look, suggesting it is from a textbook or a scholarly article. The diagrams and equations are related to counting and mathematical operations on colored squares.
Text analysis
Amazon