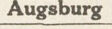
Einkommen und Miete.
Zu beachten: Je niedriger das Einkommen, desto höher die Miete!
Die Mietsquote ist bei den kleinen Einkommen gestiegen, bei den grossen gesunken!
Die Miete betrug durchschnittlich in Prozent des Einkommens:
%
30
Hamburg 1868D
1874
1891
1882
1901
25
20
15
10
0
Eink.
(Mk.)
1200
bis
1800
2400
bis
8000
006
bis
1800
bis
2400
3000
bis
8600
8600
bis
4200
4200
bis
4800
4800
bis
6000
12000
bis
80000
30000
bis
60000
6000
bis
12000
über
60000
1200
30
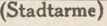
Breslau
1880
1900
25
20
15
10
0
1500 1800
bis
bis
1800 2400
2400 3000 8600 4800 6000 9000 12000 15000 18000 24000 30000 86000 48000 über
bis
bis
420
bis
600
600
bis
900 1200
bis
bis
1200
1500
Eink bis
bis 60000
bis
bis
bis
8000 3600 4800
bis bis
bis
6000 9000 12000 15000 18000 24000 30000 86000 48000 60000
bis
bis
bis
bis
(Mk) 420
006
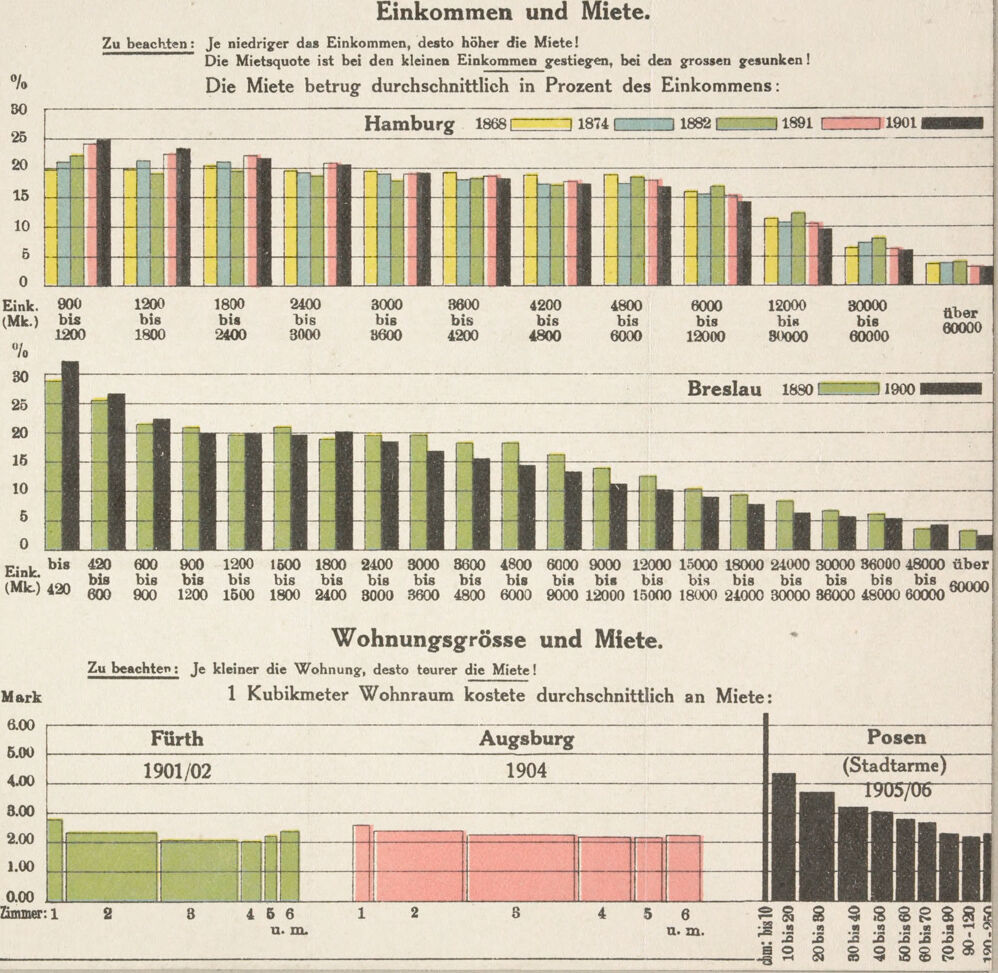
Wohnungsgrösse und Miete.
Zu beachten: Je kleiner die Wohnung, desto teurer die Miete!
1 Kubikmeter Wohnraum kostete durchschnittlich an Miete:
Mark
6.00
Posen
Fürth
Augsburg
5.00
(Stadtarme)
1905/06
1904
1901/02
4.00
8.00
2.00
1.00
0.00
Zimmer: 1
2
1
2
4
5
6
4 5 6
u. m.
n. m.
60 bis 70
190-250