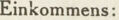
Einkommen und Miete.
Zu beachten: Je niedriger das Einkommen, desto höher die Miete!
In Prozent ihres Einkommens zahlten für Miete
mehr als
12 mehr als
3/4 mehr als
Schöneberg
1906
45
40
35
80
25
20
15
10
1500 1650 1800 2100 2400 S
bis
bis
1650 1800 2100 2400 2700
006
bis
1050
bis
1200
1200
bis
1850
1350
bis
1500
Eink
(Mk.)
bis bis
bis
1060
85
Essen
1900
80
25
20
15
10
5
0
1050
bis
1200
1200
bis
1350
660
bis
900
900
bis
1050
bis
Eink
(Mk.)
660
Die Miete betrug durchschnittlich in Prozent des Einkommens:
16 sächsische Mittel- und Kleinstädte 1905
15
10
700
bis
800
bis
400
400
bis
500
500
bis
600
600
bis
700
800
bis
900
bis
1000
1000
bis
1200
bis
1400
1400
bis
1600
1600
bis
2500 E
2000
bis
bis
2500 3000
Eink.
(Mk.)
900
1200
2000
2700-3000
8000 -3300
5800-5500
3900-4200
4500-5000
1350-1500-
1500-1650
0009-0099
09
moeot-ooo
hocoz-00ceT
4000-50dd
or-0098
29500-50000-
über10000 E
6000-8000