Machine Generated Data
Tags
Color Analysis
Categories
Imagga
| text visuals | 99.4% | |
| streetview architecture | 0.5% | |
| paintings art | 0.1% | |
Captions
Microsoft
created on 2018-03-24
| a close up of text on a white background | 84.3% | |
| a close up of text on a black background | 80.7% | |
| close up of text on a white background | 80.6% | |
OpenAI GPT
Created by gpt-4 on 2025-03-08
This image contains a piece of paper with handwritten entries organized in a structured manner, resembling a chart or a list. At the top left corner, there's a letter "B" written in large font followed by the text "24 years index genus X LIII." The main body of the text consists of rows of numbers from 1 to 24, repeated several times in each row. Alongside each row, to the right, are letters corresponding to the index (from 'a' to 'z', though the sequence is not entirely regular and includes some non-alphabetical symbols). Beneath the main list, there's a smaller table with columns labeled 1 through 7, which seems to tally something in a systematic way, with hatch marks used for counting. At the bottom left of the paper, there's a large ornate capital "B," followed by the date "1.1.19." On the bottom right of the paper, there's a clearly written "No 24 B" and "(00a:19|b61|61)," next to the date "1.1.19." The paper is framed by a wide white border or matting, which is then surrounded by a simple black frame. The contents suggest some kind of scientific or systematic investigation, possibly related to a study or research with a methodology that involves numerical and alphabetical categorization. The style of handwriting and the layout indicate that this chart could be from the early 20th century or late 19th century, given the format and use of Roman numerals. Without more context, the specific purpose or field of study related to the content cannot be determined.
Created by gpt-4o-2024-05-13 on 2025-03-08
The image shows a framed piece of artwork that consists of a handwritten table or chart. The table has several rows and columns filled with numbers and letters. - At the top, there are headings: "B," "24 years," "index," "genus," and "X F IIIIII." - Numbers from 1 to 24 are written vertically down the leftmost column. - Each row contains a sequence of repeated numbers corresponding to the number in the first column and extending horizontally. - On the right side, there is a vertical column with letters from 'a' to 'z' in order, and potentially some symbols such as 'W,' 'X,' and 'Z.' - Overall, columns are filled with the same number as the corresponding row number, repeated across the row. - Below the main table is another smaller grid with three sections labeled "I," "II," and "III," each subdivided into smaller rows and columns containing numbers from 1 to 10. This smaller grid seems to correlate specific sets of numbers to different sections. The artwork appears to be a meticulous and structured illustration, presenting what could be a mathematical or index relationship. The repetition and order suggest that the piece might be exploring numerical patterns or a form of coded information.
Anthropic Claude
Created by claude-3-haiku-20240307 on 2024-12-30
The image appears to be a handwritten numerical chart or table. It contains a grid-like structure with rows and columns filled with numbers and some text. The numbers appear to be arranged in a sequential order, possibly representing some kind of coding or numerical system. There are also some calculations or formulas written in the bottom portion of the image. Overall, the image seems to depict some kind of mathematical or numerical data, but without further context, I cannot determine the specific nature or purpose of the information presented.
Created by claude-3-opus-20240229 on 2024-12-30
The image shows a handwritten chart or table with numbers or tally marks filled in for each day over a period of time, likely tracking some kind of data or activity. The numbers are organized in a grid format with columns for each day of the month and rows for different values being tracked, though the specific meaning of the values is unclear from the information provided. There are also some additional notations and calculations at the bottom of the chart.
Created by claude-3-5-sonnet-20241022 on 2024-12-30
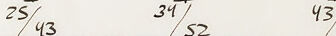
This appears to be a mathematical or organizational chart/document with two distinct sections. The top section consists of numbers 1-24 repeated in columns with corresponding letters or symbols on the right side. The bottom section shows a grid or table with numbers 1-10 arranged in rows, with additional numbers noted at specific intervals (25, 34, 43, etc.). The document has a reference "No24" and appears to be dated "1./19." There are also roman numerals (I, II, III) noted. The handwriting is neat and methodical, suggesting this might be some kind of scoring system, mathematical sequence, or organizational chart. The overall layout is very structured and precise.
Meta Llama
Created by us.meta.llama3-2-11b-instruct-v1:0 on 2025-03-15
The image presents a handwritten table of numbers, likely a mathematical or statistical analysis, with a focus on the arrangement and relationships between the numbers. * The table is divided into two main sections: + The left section contains a series of numbers, including 1, 2, 3, 4, 5, 6, 7, 8, 9, 10, 11, 12, 13, 14, 15, 16, 17, 18, 19, 20, 21, 22, 23, 24, 25, 43, 34, 52, 43/61, 25/43, 34/52, and 43/61. + The right section features a column of numbers, including 1, 2, 3, 4, 5, 6, 7, 8, 9, 10, 11, 12, 13, 14, 15, 16, 17, 18, 19, 20, 21, 22, 23, 24, 25, 43, 34, 52, 43/61, 25/43, 34/52, and 43/61. * The table also includes some handwritten notes and symbols, such as: + "B 24years" and "Index" at the top + "1/19" at the bottom + Various mathematical symbols and notations throughout the table * The background of the image is a light beige color, with a darker beige border around the edges. Overall, the image appears to be a complex mathematical or statistical analysis, with a focus on the relationships between the numbers in the table. The handwritten notes and symbols suggest that the table is a work-in-progress or a draft, rather than a final product.
Created by us.meta.llama3-2-90b-instruct-v1:0 on 2025-03-15
The image presents a framed piece of paper featuring handwritten notes and a table, likely created by Alan Turing. The top section contains a series of numbers and symbols, including Roman numerals, letters, and mathematical operations. Below this, a table with 10 rows and 5 columns is filled with numbers, accompanied by additional handwritten notes and symbols. The paper appears to be yellowed, suggesting it may be an old document or a reproduction of one. The frame surrounding the paper is white, with a thin black border around the edges. Overall, the image suggests that the paper is a historical artifact or a replica of one, possibly related to Alan Turing's work in mathematics or computer science.
Amazon Nova
Created by amazon.nova-lite-v1:0 on 2025-01-12
The image is a framed document featuring a handwritten mathematical table. The table is divided into two main sections. The upper section has a grid of numbers and letters, with the left column labeled "B 24 years" and the right column labeled "Index" and "Sexus X, III." The numbers range from 1 to 24, and each row contains a combination of numbers and letters. The lower section of the table has a grid with numbers ranging from 1 to 10, arranged in a 3x3 matrix. The document is dated "1/19" and includes a signature "D. 19." The background of the document is white, and the text is handwritten in black ink.
Created by amazon.nova-pro-v1:0 on 2025-01-12
The image is a framed piece of paper with a black border. The paper contains a table with 24 rows and 32 columns, filled with numbers and letters. The top row has the letters "B" and "a" to "z," and the leftmost column has numbers from 1 to 24. The table has a grid-like structure, with numbers and letters arranged in a specific pattern. The bottom right corner has the number "24" and the date "1/19."
Text analysis
Amazon