Machine Generated Data
Tags
Color Analysis
Categories
Imagga
| text visuals | 87% | |
| paintings art | 12.4% | |
Captions
Microsoft
created on 2022-01-14
| diagram | 34.4% | |
OpenAI GPT
Created by gpt-4 on 2024-02-07
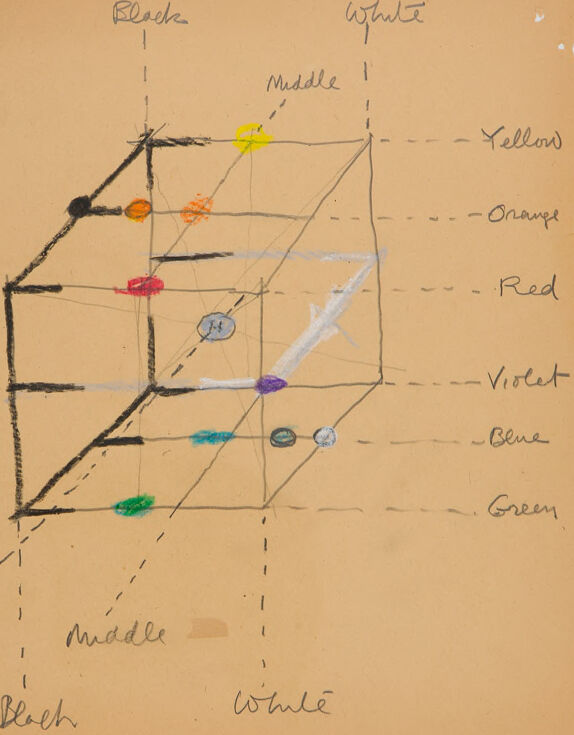
The image shows a hand-drawn diagram on a piece of aged, yellowed paper. The diagram appears to represent a three-dimensional color model or color space, with a cube-like structure that has a series of colored dots plotted within and on its surfaces. The drawn cube has its three axes labeled: one side is labeled "Black" with a dot at the corner, the opposite side is labeled "White," and along one of the edges connecting these points is the word "Middle." The other two visible faces of the cube have dotted lines extending into the cube's space, each labeled with color names: "Yellow," "Orange," "Red," "Violet," "Blue," and "Green." There are color dots placed accordingly on the cube and along the lines within, presumably indicating where each hue lies within the color space. There are additional labels such as "Neutral" along with more "Middle" labels on the bottom face of the cube, and there's what looks to be a "Black" dot with a line drawn to its matching corner label. At the top left corner of the paper, there appears to be a date or a code: "3/17/40." The nature of the diagram suggests it may be a teaching tool or a concept illustration related to art and color theory, potentially outlining the relationships between primary, secondary, and tertiary colors, as well as tints, shades, and tones. The paper's corners and edges show signs of wear and slight tearing, indicating some age and use.
Anthropic Claude
Created by claude-3-haiku-48k-20240307 on 2024-03-30
The image appears to be a hand-drawn diagram or chart. It shows a grid-like structure with various labels and colored markings. The labels indicate colors such as yellow, orange, red, violet, blue, and green. The diagram also includes the terms "Middle", "Beach", and "Whole" written in different sections. The overall impression is that this diagram is organizing or categorizing different elements, perhaps related to color theory or some other conceptual framework.
Meta Llama
Created by us.meta.llama3-2-90b-instruct-v1:0 on 2024-12-26
The image presents a hand-drawn diagram on a piece of brown paper, featuring a 3D cube with various colored dots and lines. The cube is divided into three sections, each containing a different set of colors. The top section has yellow, orange, and red dots, while the middle section has violet, blue, and green dots. The bottom section has black, white, and gray dots. The diagram also includes handwritten notes and labels, such as "3/17/40" in the top-left corner, "Black", "White", "Middle", "Red", "Violet", "Blue", "Green", "Neutral", and "Black". The background of the image is a light brown color, with a white border around the edges. Overall, the image appears to be a sketch or diagram created by an artist or designer, possibly for a project or concept related to color theory or design.
Created by us.meta.llama3-2-11b-instruct-v1:0 on 2024-12-02
The image is a hand-drawn diagram of a cube, with various colors and labels. The diagram appears to be a rough sketch, with some lines and shapes not fully formed. * A cube: + The cube is drawn in black pencil or pen. + It has six faces, each labeled with a different color: black, white, yellow, orange, red, violet, blue, and green. + The cube is positioned at an angle, with one face facing upwards and the other faces visible at an angle. * Color labels: + Each face of the cube has a small circle or oval shape drawn on it, representing the color label. + The color labels are written in pencil or pen next to each face, with some of them being partially obscured by the cube's shape. + The colors used are black, white, yellow, orange, red, violet, blue, and green. * Handwriting: + The handwriting is rough and uneven, suggesting that the diagram was drawn quickly or informally. + Some of the handwriting is difficult to read, particularly the labels on the sides of the cube. + The handwriting includes some abbreviations, such as "Neutral" and "Middle", which may indicate that the diagram is related to art or design. Overall, the diagram appears to be a rough sketch or study of a cube, possibly related to art or design. The use of different colors and labels suggests that the diagram may be exploring the properties of the cube or its relationship to other shapes.
Text analysis
Amazon