Machine Generated Data
Tags
Color Analysis
Feature analysis
Amazon
Clarifai

Clarifai
| Window | 62.3% | |


Categories
Imagga
created on 2019-06-04
| text visuals | 99.9% | |
Captions
Microsoft
created by unknown on 2019-06-04
| a close up of a piece of paper | 78.9% | |
| a piece of paper | 78.8% | |
| close up of a piece of paper | 77% | |
Salesforce
Created by general-english-image-caption-blip on 2025-05-28
a photograph of a drawing of a house with a lot of windows
Created by general-english-image-caption-blip-2 on 2025-07-05
a drawing of a house with a diagram of the different sizes
OpenAI GPT
Created by gpt-4o-2024-11-20 on 2025-06-12
The image is a historical diagram titled Housing Conditions, Lawrence, Mass., which displays the number of apartments created in new houses for each year from 1906 to 1911, specifically the layout and statistics of housing in Lawrence, Massachusetts during that period.
The diagram is organized by year, with each year's data represented by small illustrations of homes grouped according to the number of apartments each house contains:
- 1906: Houses with 2 apartments (75 units), 3 apartments (126 units), and 4 apartments (72 units).
- 1907: Houses with 2 apartments (287 units), 3 apartments (198 units), and 4 apartments (78 units).
- 1908: Houses with 2 apartments (28 units), 3 apartments (105 units), and 4 apartments (63 units).
- 1909: Houses with 2 apartments (247 units), 3 apartments (572 units), and 4 apartments (346 units).
- 1910: Houses with 2 apartments (302 units), 3 apartments (190 units), and 4 apartments (22 units).
- 1911: Houses with 2 apartments (102 units), 3 apartments (56 units), and 4 apartments (73 units).
The diagram helps visualize trends in multi-family housing construction over the years, with numerical values placed inside the house illustrations. Below the main graphic, there is text explaining that the diagram shows the distribution of new buildings in Lawrence from 1906-1911, along with references to relevant pages from The Lawrence Survey. The visual style is simple and functional, aiming to analyze housing patterns.
Created by gpt-4o-2024-08-06 on 2025-06-12
The image is a historical diagram titled "Housing Conditions, Lawrence, Mass." It illustrates the number of apartments in new houses constructed from 1906 to 1911. The diagram is part of a study that compares the data year by year for one, two, or three family houses. For each year, simplistic architectural renderings are depicted to represent different house types, each accompanied by the number of apartments created that year in such structures.
- In 1906, the diagram shows two types of houses: one with 2 family apartments (75 apartments) and one with 3 family apartments (103 apartments).
- In 1907, there are also two house types: one with 2 family apartments (287 apartments) and one with 3 family apartments (141 apartments).
- In 1908, the diagram shows two examples: in a house of 2 family apartments (71 apartments) and 3 family apartments (185 apartments).
- In 1909, a larger development is noted: one house type with 1 family apartments (247 apartments), another with 2 family apartments (372 apartments), and another with 3 family apartments (346 apartments).
- In 1910, two house types are noted: one with 1 family apartments (1304 apartments) and another with 2 family apartments (1500 apartments).
- In 1911, the drawing shows three examples: a house with just 1 apartment (106 apartments) and two houses with 3 family apartments (56 apartments).
The layout of the diagram suggests a growing trend in constructing larger apartment buildings with more families, especially as the number of 2 and 3 family apartments increases in the later years (1909-1911). The illustration provides a visual representation of this housing data to suggest trends in residential construction in Lawrence, Massachusetts during the early 20th century.
Anthropic Claude
Created by anthropic.claude-3-haiku-20240307-v1:0 on 2025-06-17
The image appears to be a historical document showing the distribution of new buildings in Lawrence, Massachusetts over several years. It contains a series of illustrations depicting the number of apartments in new houses from 1906 to 1911. The illustrations show the gradual increase in the number of apartments, providing a visual representation of the housing conditions in Lawrence during that time period.
Created by us.anthropic.claude-3-5-sonnet-20241022-v2:0 on 2025-06-17
This is a historical diagram showing housing conditions in Lawrence, Massachusetts from 1906 to 1911. The image displays architectural sketches of apartment buildings and houses, organized by year. Each building is drawn in a simple line-art style and includes the number of apartments it contains. The buildings vary in size and style, from smaller single-family homes to larger multi-unit apartment buildings.
The title at the top reads "THE NUMBER OF APARTMENTS IN NEW HOUSES" and the buildings are arranged chronologically in rows. Each building has a number indicating how many dwelling units it contains. The diagram appears to be documenting the evolution of housing development and apartment density in Lawrence during this time period.
The bottom of the image includes a caption explaining that these are diagrams showing the distribution of new buildings in Lawrence from 1906-1911, categorized by building type. This appears to be part of a larger study or report on housing conditions in early 20th century Lawrence, Massachusetts.
Meta Llama
Created by us.meta.llama3-2-11b-instruct-v1:0 on 2025-06-05
The image presents a diagram illustrating the distribution of new buildings in Lawrence, Massachusetts, from 1906 to 1911. The diagram is divided into sections, each representing a year and displaying the number of apartments in new houses for that year.
- Title: "Housing Conditions, Lawrence, Mass."
- Subtitle: "THE NUMBER OF APARTMENTS IN NEW HOUSES"
- Years: 1906, 1907, 1908, 1909, 1910, and 1911
- Number of Apartments: Each section shows the number of apartments in new houses for that year.
- Diagram: The diagram is divided into sections, each representing a year and displaying the number of apartments in new houses for that year.
The diagram provides a visual representation of the changes in housing conditions in Lawrence, Massachusetts, over a six-year period. It allows for a comparison of the number of apartments in new houses across different years, providing insights into the growth and development of the city's housing market during this time.
Created by us.meta.llama3-2-90b-instruct-v1:0 on 2025-06-05
The image depicts a historical chart illustrating the distribution of new buildings in Lawrence, Massachusetts, from 1906 to 1911. The chart is titled "Housing Conditions, Lawrence, Mass." and features a series of line drawings representing different types of buildings constructed during this period.
Chart Structure:
- The chart is divided into six sections, each representing a year from 1906 to 1911.
- Each section contains a line drawing of a building, accompanied by numerical labels indicating the number of apartments in that building.
- The buildings are categorized into three types: houses of one story, houses of two stories, and houses of three stories.
Key Findings:
- In 1906, there were 75 houses of one story, 107 houses of two stories, and 72 houses of three stories.
- In 1907, there were 655 houses of one story, 284 houses of two stories, and 79 houses of three stories.
- In 1908, there were 105 houses of one story, 83 houses of two stories, and 65 houses of three stories.
- In 1909, there were 247 houses of one story, 172 houses of two stories, and 46 houses of three stories.
- In 1910, there were 159 houses of one story, 200 houses of two stories, and 159 houses of three stories.
- In 1911, there were 69 houses of one story, 102 houses of two stories, and 57 houses of three stories.
Conclusion:
The chart provides valuable insights into the housing conditions in Lawrence, Massachusetts, during the early 20th century. It highlights the growth of new buildings and the shift towards larger, multi-story dwellings. The data presented in the chart can be useful for historians, urban planners, and researchers interested in understanding the evolution of housing patterns in the region.
Amazon Nova
Created by amazon.nova-lite-v1:0 on 2025-06-04
The image shows a diagram titled "Housing Conditions, Lawrence, Mass." The diagram depicts the distribution of new buildings in Lawrence, Massachusetts, from 1906 to 1911, categorized by the number of apartments in each building. It is labeled with the years 1906, 1907, 1908, 1909, 1910, and 1911, with each year having a different set of buildings with varying numbers of apartments. The diagram also includes a reference to "The Lawrence Survey" on page 32, number 29.24.11.
Created by amazon.nova-pro-v1:0 on 2025-06-04
The image is a black-and-white diagram titled "Housing Conditions, Lawrence, Mass." It depicts the distribution of new buildings in Lawrence between 1906 and 1911, categorized by the number of apartments. The diagram shows the number of new houses built each year, grouped by the number of apartments they contain. The years are listed from 1906 to 1911, with each year showing the number of houses built with 1, 2, 3, 4, and more than 4 apartments. The diagram also includes a note at the bottom referencing "The Lawrence Survey," page 32, No. 29.24.1.
Google Gemini
Created by gemini-2.0-flash-lite on 2025-05-31
The image is a diagram about housing conditions in Lawrence, Massachusetts, from 1906 to 1911. The diagram shows the number of apartments in new houses grouped for each year in relation to the three-family houses. The buildings are illustrated by area. There are rows of building illustrations for each of the years, and the number of apartments is written above the drawings. At the bottom of the image is a description about the diagram.
Created by gemini-2.0-flash on 2025-05-31
Here is a description of the image based on the provided context:
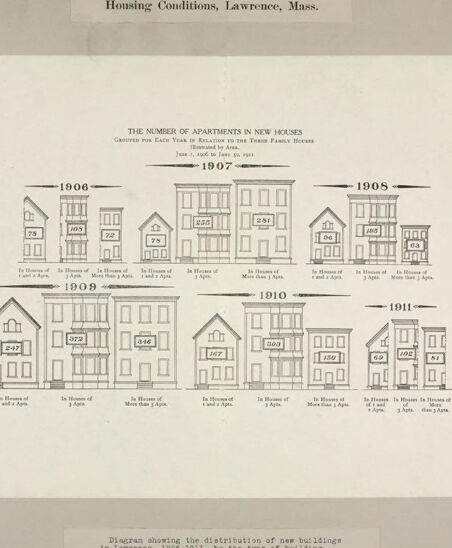
The image shows a document or page titled "Housing Conditions, Lawrence, Mass." It features a diagram titled "The Number of Apartments in New Houses" grouped for each year in relation to the three family houses illustrated by Area. Data covers June 1, 1906, to June 30, 1911.
The diagram is organized by year from 1906 to 1911. Under each year, there are illustrations of house types labeled as "In Houses of 1 and 2 Apts.", "In Houses of 3 Apts.", and "In Houses of More than 3 Apts." Each house illustration contains a number.
Below the diagram, there's a caption: "Diagram showing the distribution of new buildings in Lawrence, 1906-1911, by the type of building. (See 'The Lawrence Survey', page 32. No. 29.24.15)."
Mistral Pixtral
Created by us.mistral.pixtral-large-2502-v1:0 on 2025-06-06
The image is a historical document titled "Housing Conditions, Lawrence, Mass." It provides a detailed visual representation of the number of apartments in new houses constructed in Lawrence, Massachusetts, between January 1, 1906, and April 30, 1911. The data is categorized by the type of building and the number of apartments per building.
The diagram is divided into six sections, each corresponding to a specific year:
1906:
- 2 Houses of 1 Apartment
- 2 Houses of 2 Apartments
- 1 House of 3 Apartments
- 1 House of More Than 3 Apartments
1907:
- 2 Houses of 1 Apartment
- 2 Houses of 2 Apartments
- 1 House of 3 Apartments
- 1 House of More Than 3 Apartments
1908:
- 1 House of 1 Apartment
- 2 Houses of 2 Apartments
- 1 House of 3 Apartments
- 2 Houses of More Than 3 Apartments
1909:
- 1 House of 1 Apartment
- 2 Houses of 2 Apartments
- 1 House of 3 Apartments
- 2 Houses of More Than 3 Apartments
1910:
- 2 Houses of 1 Apartment
- 2 Houses of 2 Apartments
- 1 House of 3 Apartments
- 1 House of More Than 3 Apartments
1911 (January 1 to April 30):
- 1 House of 1 Apartment
- 2 Houses of 2 Apartments
- 1 House of 3 Apartments
- 1 House of More Than 3 Apartments
The diagram effectively shows the distribution of new buildings in Lawrence during the specified period, illustrating the variety in the number of apartments per building constructed each year. The visuals use small house illustrations to represent the different types of buildings and the number of apartments within them.
Qwen
Text analysis
Amazon