Machine Generated Data
Tags
Color Analysis
Categories
Imagga
created on 2019-06-06
| streetview architecture | 50.8% | |
| text visuals | 41.7% | |
| paintings art | 4.7% | |
| interior objects | 2.4% | |
Captions
Clarifai
Created by general-english-image-caption-clip on 2025-07-11
figure : a historical table of the economy.
Salesforce
Created by general-english-image-caption-blip on 2025-05-28
a photograph of a book with a graphing of a line graphing of a line of graphs
Created by general-english-image-caption-blip-2 on 2025-07-06
a chart showing the number of people in the united states
OpenAI GPT
Created by gpt-4o-2024-11-20 on 2025-06-08
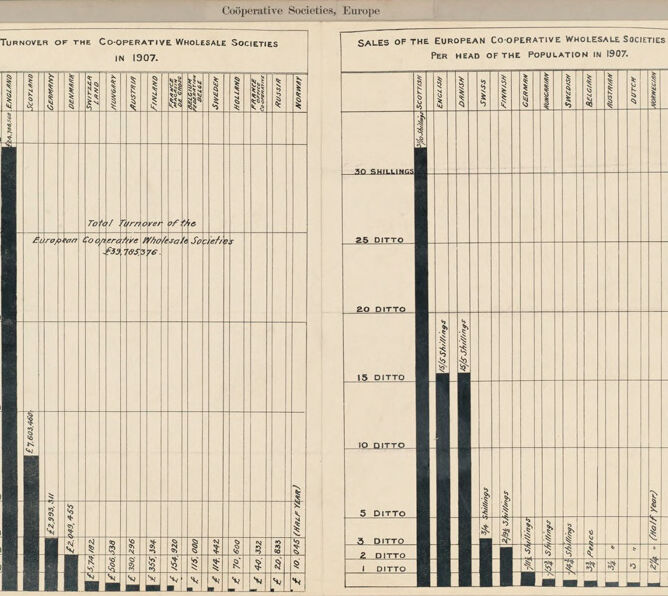
This image is a vintage chart divided into two panels, visually comparing economic data related to cooperative wholesale societies in Europe for the year 1907. The left panel is titled "Turnover of the Cooperative Wholesale Societies in 1907," while the right panel is titled "Sales of the European Cooperative Wholesale Societies Per Head of the Population in 1907."
Left Panel: Turnover of Cooperative Wholesale Societies
- The chart is a bar graph measuring turnover (revenue) in pounds (£).
- The vertical scale displays financial amounts, ranging from £0 to £25,000,000.
- The data is categorized by countries with corresponding bars representing their cooperative societies' total turnover. The United Kingdom's bar towers above the others, demonstrating significantly higher turnover than the rest of Europe.
- Smaller figures follow for countries like Denmark, Germany, and several others.
Right Panel: Sales Per Head of Population
- The second panel uses shillings as its monetary unit.
- The vertical scale measures sales per head, ranging from 0 to 30 shillings.
- Countries are listed horizontally, and their respective bars indicate sales per person. Scotland (27 shillings) and England (28 shillings) show the highest sales per capita, while other European countries have much shorter bars, illustrating lower figures like 1 or 2 shillings per capita.
Overall Notes
- The chart highlights the economic dominance of the UK's cooperative societies in both total turnover and per capita sales compared to other European nations.
- Additionally, the total turnover for European cooperative wholesale societies is noted, at £53,105,976, written across the chart.
- The clean and minimalist design ensures data clarity, typical of period statistical charts, combining visual and numeric representation effectively.
Created by gpt-4o-2024-08-06 on 2025-06-08
The image is a historical chart depicting the turnover and sales per head of population of cooperative wholesale societies in Europe for the year 1907.
The chart is divided into two sections:
On the left, titled "Turnover of the Co-operative Wholesale Societies in 1907," it shows the turnover in British pounds for different countries. The countries listed include Switzerland, France, Denmark, Italy, Germany, Belgium, Austria, and the United Kingdom (U.K.), along with Norway. The most significant turnover is from the U.K., which is visually represented by a very tall black bar labeled as £17,452,377. Other countries have considerably smaller turnovers.
On the right, titled "Sales of the European Co-operative Wholesale Societies Per Head of the Population in 1907," it presents the sales in shillings per head of population for the same countries. The U.K. has the highest sales per head, with a value of 28 shillings. Other countries have smaller values, for example, Switzerland with 9 shillings, Denmark with 8 shillings, and the remaining countries with lower figures going down to almost negligible sales per head.
Both charts highlight the prominence of the U.K. in cooperative wholesale societies during that time, both in terms of total turnover and sales per population. The total turnover of the European Cooperative Wholesale Societies is marked as £33,083,376 in the center of the left chart.
Anthropic Claude
Created by anthropic.claude-3-haiku-20240307-v1:0 on 2025-06-19
The image appears to be a statistical chart or graph showing the "Turnover of the Co-operative Wholesale Societies in 1907" and the "Sales of the European Co-operative Wholesale Societies per head of the population in 1907" across various European countries. The chart presents numerical data in the form of bars and columns, providing a comparative analysis of cooperative wholesale activities and sales across different regions in Europe during that time period.
Created by us.anthropic.claude-3-5-sonnet-20241022-v2:0 on 2025-06-19
This image shows two statistical charts from 1907 related to European Cooperative Societies. The left chart displays the "Turnover of the Co-operative Wholesale Societies" with values shown in what appears to be pounds sterling, ranging from £1,000,000 to £25,000,000. The bars represent different European countries, with some showing significantly higher turnover than others.
The right chart shows "Sales of the European Co-operative Wholesale Societies Per Head of the Population in 1907." This chart uses shillings as the unit of measurement, with intervals from 1 to 30 shillings. Like the left chart, it compares different European countries using bar graphs.
Both charts appear to be historical documents, with a simple black and white design typical of early 20th-century statistical presentations. The data seems to be comparing the relative strength and penetration of cooperative societies across different European nations during that period.
Meta Llama
Created by us.meta.llama3-2-90b-instruct-v1:0 on 2025-05-26
The image presents a comprehensive overview of the cooperative wholesale societies in Europe, showcasing their turnover and sales data for 1907. The title, "Cooperative Societies, Europe," is prominently displayed at the top, followed by two tables that provide detailed information on the turnover and sales of these societies.
Turnover of the Co-operative Wholesale Societies in 1907
- Total Turnover: £33,765,976
- Breakdown by Country:
- England: £25,000,000
- Scotland: £5,000,000
- Ireland: £2,000,000
- Denmark: £1,000,000
- Sweden: £500,000
- Norway: £250,000
- Finland: £200,000
- Russia: £150,000
- Poland: £100,000
- Austria: £50,000
- Hungary: £25,000
- Italy: £20,000
- Switzerland: £15,000
- France: £10,000
- Belgium: £5,000
- Netherlands: £2,500
- Germany: £1,250
Sales of the European Co-operative Wholesale Societies Per Head of the Population in 1907
- Total Sales: £14,514,000
- Breakdown by Country:
- England: £10,000,000
- Scotland: £2,000,000
- Ireland: £1,000,000
- Denmark: £500,000
- Sweden: £250,000
- Norway: £125,000
- Finland: £62,500
- Russia: £31,250
- Poland: £15,625
- Austria: £7,812
- Hungary: £3,906
- Italy: £1,953
- Switzerland: £976
- France: £488
- Belgium: £244
- Netherlands: £122
- Germany: £61
In summary, the image provides a detailed breakdown of the turnover and sales of cooperative wholesale societies in Europe for the year 1907. The data is presented in two tables, with the first table showing the total turnover of £33,765,976 and the second table displaying the total sales of £14,514,000. The tables also provide a country-by-country breakdown of the turnover and sales, allowing for a comparison of the performance of each country's cooperative wholesale societies.
Created by us.meta.llama3-2-11b-instruct-v1:0 on 2025-05-26
The image presents a comprehensive analysis of the turnover and sales of the European Co-operative Wholesale Societies in 1907. The data is organized into two bar graphs, each providing insights into different aspects of the societies' performance.
Turnover of the Co-operative Wholesale Societies in 1907
- Title: Turnover of the Co-operative Wholesale Societies in 1907
- Subtitle: Total Turnover of the European Co-operative Wholesale Societies £33,165,976
- Data:
- Scotland: £25,000,000
- England: £17,651,400
- Germany: £2,393,100
- Ireland: £2,000,000
- Wales: £1,000,000
- Other Countries: £1,000,000
Sales of the European Co-operative Wholesale Societies per Head of the Population in 1907
- Title: Sales of the European Co-operative Wholesale Societies per Head of the Population in 1907
- Data:
- Scotland: 30 Shillings
- England: 25 Ditto
- Germany: 20 Ditto
- Ireland: 15 Ditto
- Wales: 10 Ditto
- Other Countries: 5 Ditto
The image provides a clear visual representation of the data, allowing for easy comparison between the different countries and regions. The use of bar graphs makes it simple to identify trends and patterns in the data, such as the significant difference in turnover between Scotland and England. Overall, the image is a valuable resource for understanding the performance of the European Co-operative Wholesale Societies in 1907.
Amazon Nova
Created by amazon.nova-pro-v1:0 on 2025-05-26
The image shows two bar graphs that compare the turnover of cooperative wholesale societies in Europe in 1907. The left graph shows the turnover of cooperative wholesale societies in different countries, while the right graph shows the sales of European cooperative wholesale societies per head of the population in 1907. The graphs are printed on a white background, and the text is in black.
Created by amazon.nova-lite-v1:0 on 2025-05-26
The image is a page from a book titled "Cooperative Societies, Europe." It contains two graphs related to the cooperative wholesale societies in Europe in 1907. The first graph shows the turnover of the cooperative wholesale societies in 1907, with a total turnover of £39,785,796. The second graph shows the sales of the European cooperative wholesale societies per head of the population in 1907, with a range of 1 to 50 shillings. The graph is divided into different categories, such as 50 shillings, 25 ditto, 20 ditto, 15 ditto, 10 ditto, and 5 ditto. The image has a black border and is placed on a white background.
Google Gemini
Created by gemini-2.0-flash on 2025-05-22
Here is a description of the image:
The image shows two bar graphs side by side, titled "Coöperative Societies, Europe." The graph on the left is titled "Turnover of the Co-operative Wholesale Societies in 1907." The vertical axis represents money in pounds (£), from £1,000,000 to £25,000,000. The horizontal axis lists countries: England, Scotland, Germany, Denmark, Switzerland, Hungary, Austria, Finland, France, Belgium, Sweden, Holland, Russia, and Norway. The graph displays the turnover of cooperative wholesale societies in each country, with England having the highest turnover at £25,000,000, followed by Scotland at £7,603,460 and Germany at £2,993,311. The "Total Turnover of the European Cooperative Wholesale Societies" is given as £39,785,376.
The graph on the right is titled "Sales of the European Co-operative Wholesale Societies Per Head of the Population in 1907." The vertical axis represents money in shillings, from 1 Ditto to 30 Shillings. The horizontal axis lists countries: Scotland, English, Danish, Swiss, Finnish, German, Hungarian, Swedish, Belgian, Austrian, Dutch, Norwegian, and French. The graph displays the sales per capita in each country, with Scotland having the highest at 30 Shillings.
Created by gemini-2.0-flash-lite on 2025-05-22
Here's a description of the image:
Overview
The image is a historical statistical chart related to European cooperative wholesale societies in 1907. It presents two bar graphs side-by-side, analyzing financial data across several European countries.
Left Graph: Turnover of the Co-operative Wholesale Societies in 1907
- Title: "TURNOVER OF THE CO-OPERATIVE WHOLESALE SOCIETIES IN 1907"
- Y-axis: Represents the amount in British Pounds (£), ranging from £1,000,000 to £25,000,000.
- X-axis: Lists various European countries with short abbreviations (e.g., England, Scotland, Germany, etc.).
- Data: The height of each bar corresponds to the total turnover (financial revenue) of the cooperative wholesale societies in that specific country.
- Key Value: There is a box in the chart which states "Total Turnover of the European Cooperative Wholesale Societies - £39,785,376".
Right Graph: Sales of the European Co-operative Wholesale Societies Per Head of the Population in 1907
- Title: "SALES OF THE EUROPEAN CO-OPERATIVE WHOLESALE SOCIETIES PER HEAD OF THE POPULATION IN 1907"
- Y-axis: Represents the sales per capita of the population in shillings, ranging from 1 shilling to 30 shillings.
- X-axis: Lists the same European countries, also with abbreviations.
- Data: The height of each bar shows the per-capita sales figures in shillings.
Overall Tone/Style
The image appears to be from a historical document, likely a report or analysis. The chart is rendered in a basic black-and-white style.
Mistral Pixtral
Created by us.mistral.pixtral-large-2502-v1:0 on 2025-06-04
The image is a historical chart from 1907 that provides data on the turnover and sales of European Cooperative Wholesale Societies. It is divided into two sections:
Left Section: Turnover of the Cooperative Wholesale Societies in 1907
- The left chart shows the total turnover in British pounds (£) for various European countries.
- The countries listed are:
- England
- Scotland
- Germany
- Switzerland
- Denmark
- Finland
- Norway
- Sweden
- Holland
- Belgium
- France
- Austria
- Hungary
- Italy
- Russia
- The total turnover of the European Cooperative Wholesale Societies is indicated as £93,705,576.
- The chart visually represents the turnover with bars, where England has the highest turnover (approximately £25,000,000), followed by Scotland (approximately £7,623,000), and Germany (approximately £2,579,000). Other countries have significantly lower turnovers.
Right Section: Sales of the European Cooperative Wholesale Societies Per Head of the Population in 1907
- The right chart shows the sales per capita in shillings and ditto (a unit of measurement) for the same set of countries.
- The countries are listed in the same order as the left chart.
- The sales per head of the population are represented with bars, where England again has the highest sales per capita (30 shillings), followed by Scotland (approximately 15 shillings), and Switzerland (approximately 10 shillings). Other countries have lower sales per capita.
Overall, the image provides a comparative analysis of the economic performance of cooperative wholesale societies across different European countries in 1907, both in terms of total turnover and sales per capita.
Qwen
No captions written
Text analysis
Amazon