Machine Generated Data
Tags
Color Analysis
Feature analysis
Amazon
Clarifai
AWS Rekognition
| Document | 55.4% | |

Categories
Imagga
created on 2019-06-05
| text visuals | 99.8% | |
Captions
Microsoft
created by unknown on 2019-06-05
| a close up of text on a white background | 88.1% | |
| a close up of text on a black background | 84.4% | |
| a close up of text on a white surface | 84.3% | |
Clarifai
No captions written
Salesforce
Created by general-english-image-caption-blip on 2025-05-29
a photograph of a chart of a chart of the state of california
Created by general-english-image-caption-blip-2 on 2025-07-06
a chart showing the number of people who have been helped by the state board of charity
OpenAI GPT
Created by gpt-4o-2024-11-20 on 2025-06-08
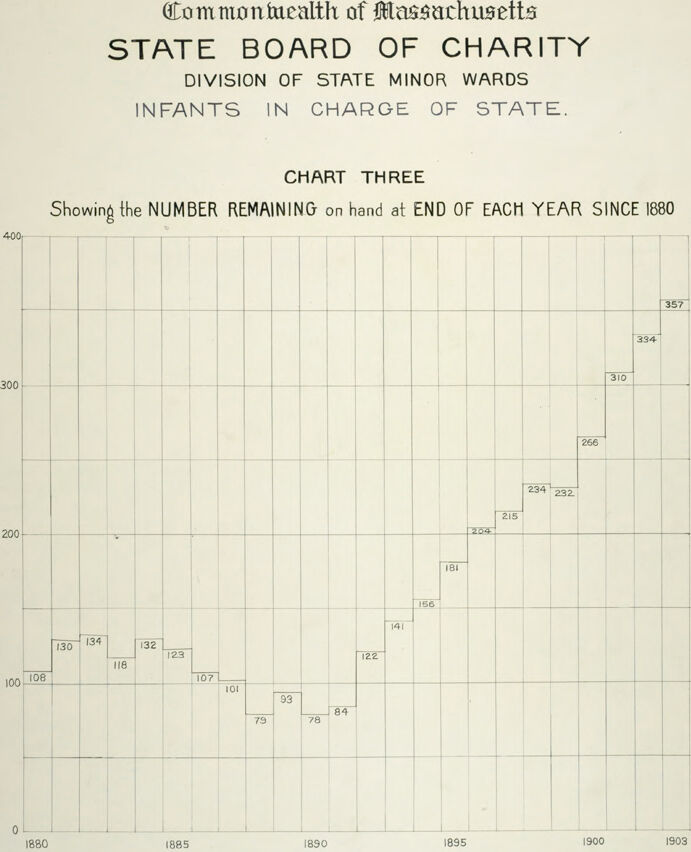
This image is a chart titled "Commonwealth of Massachusetts, State Board of Charity, Division of State Minor Wards, Infants in Charge of State." It is labeled as "Chart Three" and illustrates the number of infants under state care remaining at the end of each year from 1880 to 1903.
The vertical axis represents the number of infants, ranging from 0 to 400, with increments of 100. The horizontal axis displays years, marked at regular intervals from 1880 to 1903.
The plotted data shows a fluctuating trend, starting with 108 infants in 1880. The numbers initially rise and fall, reaching a low point of 78 infants around 1890. After this, there is a steady increase in the chart from 1890 onward, culminating at 357 infants in 1903.
Created by gpt-4o-2024-08-06 on 2025-06-08
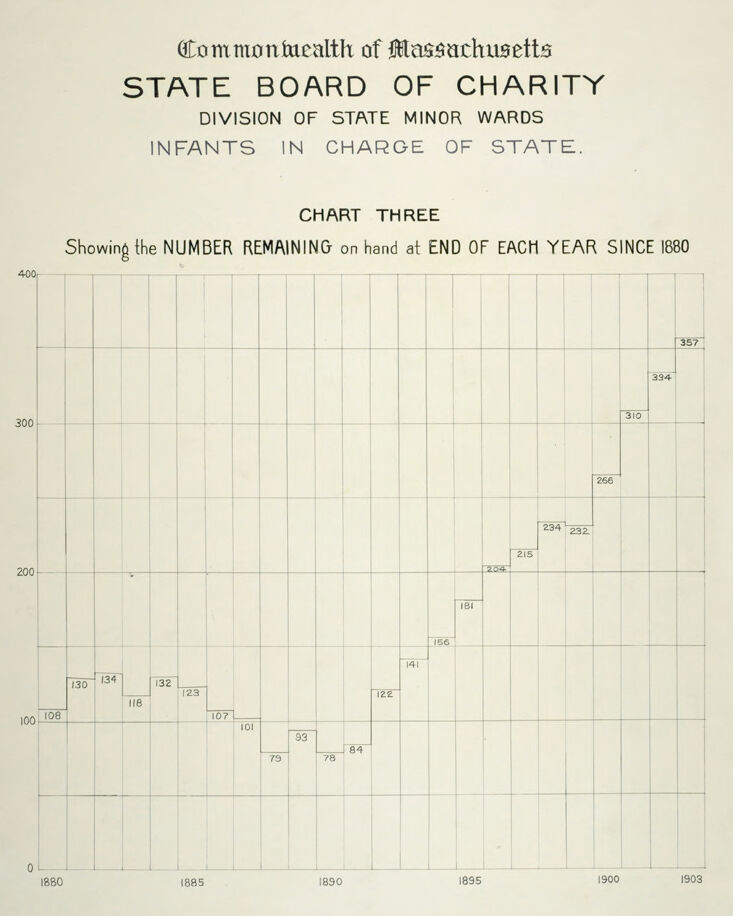
The image is a historical chart from the Commonwealth of Massachusetts State Board of Charity. It is labeled "Chart Three" and shows data for "Infants in Charge of State." Specifically, it illustrates the "Number Remaining on hand at End of Each Year Since 1880."
The chart is a line graph with vertical bars representing the number of infants under state care from 1880 to 1903. The y-axis indicates the number of infants, ranging from 0 to 400, in increments of 100. The x-axis is labeled with years, starting from 1880 and ending at 1903.
The graph shows an initially low number of infants (108 in 1880), increasing gradually over the years, peaking at 157 in 1903. Over time, there are fluctuations in the numbers, with notable increases starting around 1895. For each year, a number is noted on the graph indicating the count of infants for that particular year-end.
Anthropic Claude
Created by anthropic.claude-3-haiku-20240307-v1:0 on 2025-06-16
The image appears to be a chart or graph titled "Chart Three" from the Commonwealth of Massachusetts State Board of Charity, Division of State Minor Wards. It shows the "NUMBER REMAINING on hand at END OF EACH YEAR SINCE 1880" for "INFANTS IN CHARGE OF STATE". The chart displays the numerical values for each year from 1880 to 1903, with the y-axis showing the number of infants and the x-axis showing the years.
Created by us.anthropic.claude-3-5-sonnet-20241022-v2:0 on 2025-06-16
This is a historical chart from the Commonwealth of Massachusetts State Board of Charity, specifically from their Division of State Minor Wards. Titled "Chart Three," it shows the number of infants in state charge remaining at the end of each year from 1880 to 1903.
The graph shows a general upward trend over this period. Starting from relatively low numbers around 100 in 1880, the number of infants in state care increased significantly by the turn of the century. Some specific data points include:
- Around 1880: approximately 100 infants
- Mid-1880s: fluctuating between 100-130 infants
- 1890s: showing a marked increase
- By 1900: reaching over 300 infants
- 1903: showing the highest number at around 357 infants
The chart uses a simple line graph format with a grid background and numerical markers along the vertical axis up to 400. It's a clear visualization of the growing number of infants under state care during this period of Massachusetts history.
Meta Llama
Created by us.meta.llama3-2-90b-instruct-v1:0 on 2025-05-25
The image presents a chart titled "Commonwealth of Massachusetts STATE BOARD OF CHARITY DIVISION OF STATE MINOR WARDS INFANTS IN CHARGE OF STATE." The chart is divided into two sections: the title and the chart itself.
Title Section:
- The title is written in black text at the top of the image.
- It includes the name of the state, the department responsible for the data, and a brief description of the information being presented.
Chart Section:
- The chart is a bar graph that displays the number of infants in charge of the state from 1880 to 1903.
- The x-axis represents the years, while the y-axis represents the number of infants.
- The chart shows a steady increase in the number of infants over the years, with some fluctuations.
- The chart also includes a subtitle that reads "CHART THREE Showing the NUMBER REMAINING on hand at END OF EACH YEAR SINCE 1880."
Additional Information:
- The chart appears to be part of a larger report or document, as indicated by the page number "3" in the top-right corner.
- The chart is likely used to track and analyze trends in the number of infants in care of the state over time.
Overall, the image provides a clear and concise visual representation of the data, making it easy to understand and interpret the trends and patterns in the number of infants in care of the state.
Created by us.meta.llama3-2-11b-instruct-v1:0 on 2025-05-25
The image presents a chart titled "STATE BOARD OF CHARITY" and subtitled "DIVISION OF STATE MINOR WARDS INFANTS IN CHARGE OF STATE." The chart is divided into two sections: the top section displays the title and subtitle, while the bottom section features a grid with numbers and labels.
Top Section:
- Title: "STATE BOARD OF CHARITY"
- Subtitle: "DIVISION OF STATE MINOR WARDS INFANTS IN CHARGE OF STATE."
Bottom Section:
- Grid with numbers and labels:
- X-axis: Labeled with years from 1880 to 1903.
- Y-axis: Labeled with numbers ranging from 0 to 400.
- Numbers within the grid: Representing the number of infants in charge of the state for each year.
- Labels: "CHART THREE" and "Showing the NUMBER REMAINING on hand at END OF EACH YEAR SINCE 1880."
The chart appears to be a historical record of the number of infants in the care of the state, with data spanning from 1880 to 1903.
Amazon Nova
Created by amazon.nova-pro-v1:0 on 2025-05-25
The image is a chart titled "Chart Three" from the Commonwealth of Massachusetts State Board of Charity, Division of State Minor Wards, specifically focusing on infants in charge of the state. The chart presents data on the number of infants remaining under state care at the end of each year since 1880.
The chart is structured as a line graph with a vertical axis labeled from 0 to 400, representing the number of infants. The horizontal axis is labeled with years, starting from 1880 and ending in 1903. The years are marked at intervals of five years: 1880, 1885, 1890, 1895, and 1900, with additional markers for each year in between.
The data points are plotted on the graph, showing the number of infants in state care at the end of each year. The numbers are as follows:
- 1880: 108
- 1881: 130
- 1882: 134
- 1883: 132
- 1884: 118
- 1885: 123
- 1886: 107
- 1887: 101
- 1888: 93
- 1889: 79
- 1890: 78
- 1891: 84
- 1892: 141
- 1893: 156
- 1894: 181
- 1895: 204
- 1896: 215
- 1897: 234
- 1898: 232
- 1899: 266
- 1900: 310
- 1901: 334
- 1902: 357
The chart shows a general trend of fluctuation in the number of infants in state care, with a noticeable increase starting around 1892 and continuing through 1902. The highest number of infants in care was recorded in 1902, with 357 infants, while the lowest number was in 1889, with 78 infants.
This data likely reflects changes in social conditions, policies, or economic factors that influenced the number of infants requiring state care over the years.
Created by amazon.nova-lite-v1:0 on 2025-05-25
The image is a chart from the Commonwealth of Massachusetts State Board of Charity, Division of State Minor Wards, specifically Chart Three. It depicts the number of infants in state care at the end of each year from 1880 to 1903. The chart shows a gradual decline in the number of infants in state care over the years, with the highest number recorded at 357 in 1880 and the lowest at 78 in 1895. The chart also includes a table with numerical data for each year, indicating the number of infants in state care.
Google Gemini
Created by gemini-2.0-flash-lite on 2025-05-22
Here is a description of the image:
The image is a historical line graph titled "Chart Three," created by the Massachusetts State Board of Charity. The graph shows "the NUMBER REMAINING on hand at END OF EACH YEAR SINCE 1880" for infants in charge of the state.
The x-axis represents the years, starting from 1880 and extending to 1903, with increments of approximately 5 years. The y-axis shows the number of infants, ranging from 0 to 400, with increments of 100.
The graph displays a general upward trend, with the number of infants increasing over time. The line starts at a value of 108 in 1880 and then fluctuates, with a low point in the 1890s. However, in the later years, there is a clear increase, with the number of infants reaching 357 by 1903.
The graph has a grid of horizontal and vertical lines and the values along the line at various points are shown.
Created by gemini-2.0-flash on 2025-05-22
Here is a description of the image:
The image is a scan of a historical chart titled "Chart Three" from the Commonwealth of Massachusetts, State Board of Charity, Division of State Minor Wards, Infants in Charge of State. The chart shows the number of infants remaining in state care at the end of each year since 1880. The x-axis indicates the years, starting from 1880 and extending to 1903, with markings at 1880, 1885, 1890, 1895, 1900, and 1903. The y-axis represents the number of infants, ranging from 0 to 400, with horizontal grid lines marking increments of 100.
The chart displays a line graph with data points representing the number of infants at the end of each year. The numbers are indicated near each data point. Starting from 1880, the number of infants is 108, followed by 130, 134, 132, 123, 118, 107, 101, 93, 79, 78, 84, 122, 141, 156, 181, 204, 215, 234, 232, 266, 310, 334, and 357 in 1903.
Mistral Pixtral
Created by us.mistral.pixtral-large-2502-v1:0 on 2025-05-26
The image is a historical chart from the Commonwealth of Massachusetts, specifically from the State Board of Charity, Division of State Minor Wards. The chart is titled "Infants in Charge of State" and is labeled as "Chart Three." It shows the number of infants remaining in state care at the end of each year from 1880 to 1903.
Here is a detailed summary of the data presented in the chart:
- 1880: 130 infants
- 1881: 108 infants
- 1882: 134 infants
- 1883: 116 infants
- 1884: 132 infants
- 1885: 123 infants
- 1886: 107 infants
- 1887: 101 infants
- 1888: 79 infants
- 1889: 93 infants
- 1890: 78 infants
- 1891: 84 infants
- 1892: 122 infants
- 1893: 141 infants
- 1894: 156 infants
- 1895: 181 infants
- 1896: 229 infants
- 1897: 215 infants
- 1898: 234 infants
- 1899: 232 infants
- 1900: 310 infants
- 1901: 334 infants
- 1902: 357 infants
The chart indicates a general upward trend in the number of infants in state care over the years, with some fluctuations. The number of infants increases significantly from 1892 onwards, reaching a peak of 357 infants by 1902.
Qwen
No captions written
Text analysis
Amazon