Machine Generated Data
Tags
Color Analysis
Feature analysis
Amazon
Clarifai

Clarifai
| Animal | 77.9% | |
Categories
Imagga
created on 2019-06-04
| paintings art | 83.9% | |
| text visuals | 14.1% | |
| food drinks | 1.9% | |
Captions
Microsoft
created by unknown on 2019-06-04
| a close up of a map | 78.2% | |
| close up of a map | 74.1% | |
| a map with text | 66.3% | |
Clarifai
No captions written
Salesforce
Created by general-english-image-caption-blip on 2025-05-28
a photograph of a map of the united states of america
Created by general-english-image-caption-blip-2 on 2025-07-05
a map of the united states showing the distribution of the population
OpenAI GPT
Created by gpt-4o-2024-11-20 on 2025-06-13
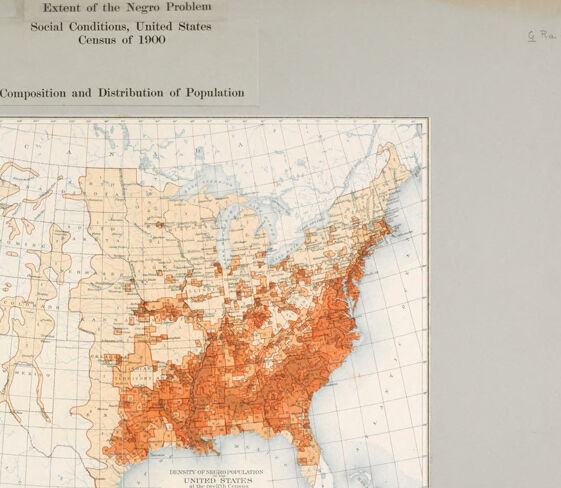
This image is a historical map titled "Extent of the Negro Problem: Social Conditions, United States Census of 1900," which depicts the distribution and composition of the African American population in the United States based on census data from 1900. The map utilizes color gradients to represent the density of the African American population across different regions of the country.
The darkest shades of orange represent the highest concentrations of African Americans, primarily located in the southeastern states, which align with areas such as the Deep South. The density decreases progressively with lighter shades of orange as one moves away from the South toward the Midwest, Northeast, and West, where populations were sparser.
The map serves as a visual reflection of demographic trends during this time, illustrating the societal conditions of African Americans at the dawn of the 20th century, which were heavily influenced by historical events like slavery and Reconstruction.
Created by gpt-4o-2024-08-06 on 2025-06-13
The image is a historical map titled "Extent of the Negro Problem: Social Conditions, United States Census of 1900 - Composition and Distribution of Population." It depicts the density of the African American population in the United States according to the census of 1900. The map uses shades of red and orange to indicate varying levels of population density.
- Areas with dark red color indicate the highest concentrations of African Americans, notably in the southern United States.
- Areas with lighter shades mark areas with lower densities of African American populations.
- The map shows a concentration of African American populations primarily in the southeastern states, reflecting the historical distribution following the Civil War and the abolition of slavery.
- The rest of the United States, especially the western and northern regions, are depicted with much lighter shades or are uncolored, indicating lower densities of African American populations at that time.
- The map includes a key in the lower left corner, distinguishing the different density levels by color.
- The overall layout includes the states of the U.S. with state boundaries and major rivers drawn, providing geographical context to the distribution data.
Anthropic Claude
Created by anthropic.claude-3-haiku-20240307-v1:0 on 2025-06-17
The image appears to be a map of the United States, titled "Extent of the Negro Problem: Social Conditions, United States, Census of 1900." The map depicts the distribution and composition of the population, with darker shaded areas indicating a higher concentration of the African American population. The map provides a visual representation of the racial demographics in the United States at the time, as recorded in the 1900 census.
Created by us.anthropic.claude-3-5-sonnet-20241022-v2:0 on 2025-06-17
This is a historical map from the 1900 U.S. Census titled "Extent of the Negro Problem - Social Conditions, United States Census of 1900" showing the "Composition and Distribution of Population." The map displays the United States with varying shades of orange/brown coloring indicating population distribution. The darkest coloring is concentrated in the southeastern United States, particularly in what appears to be the Deep South states, with the intensity of the coloring gradually decreasing as you move north and west. The western states and territories show very light coloring or none at all. The map uses a gradient scale shown in the legend, though the specific percentages are not clearly visible in this image. This appears to be a demographic visualization showing population patterns during that historical period.
Meta Llama
Created by us.meta.llama3-2-11b-instruct-v1:0 on 2025-06-11
The image presents a map of the United States, titled "Extent of the Negro Problem: Social Conditions, United States Census of 1900." The map is divided into states and territories, with each state colored according to its population density. The color key indicates that the darker orange areas represent higher population densities, while the lighter orange areas represent lower population densities.
- Title
- The title of the map is "Extent of the Negro Problem: Social Conditions, United States Census of 1900."
- It is written in black text at the top of the image.
- Map
- The map is a rectangular shape with a grid pattern.
- It shows the United States, including all 48 states and several territories.
- Each state is colored according to its population density.
- The color key indicates that the darker orange areas represent higher population densities, while the lighter orange areas represent lower population densities.
- Color Key
- The color key is located in the bottom-left corner of the image.
- It shows a range of colors, from light orange to dark orange, with corresponding population density values.
- The color key indicates that the darker orange areas represent higher population densities, while the lighter orange areas represent lower population densities.
- Background
- The background of the image is a light gray color.
- It provides a neutral backdrop for the map and title.
Overall, the image provides a visual representation of the population density of the United States in 1900, with darker orange areas indicating higher population densities and lighter orange areas indicating lower population densities. The map is useful for understanding the distribution of population across different regions of the country during this time period.
Created by us.meta.llama3-2-90b-instruct-v1:0 on 2025-06-11
The image presents a map of the United States, titled "Extent of the Negro Problem Social Conditions, United States Census of 1900," which illustrates the distribution and composition of the population. The map is divided into sections, with each section representing a different level of population density. The key at the bottom left corner explains that the darker shades indicate higher population densities, while the lighter shades represent lower densities.
Key Features:
- Title: "Extent of the Negro Problem Social Conditions, United States Census of 1900"
- Map: A map of the United States, divided into sections representing different population densities
- Key: A key at the bottom left corner explaining the color coding for population density
- Color Coding: Darker shades indicate higher population densities, while lighter shades represent lower densities
Conclusion:
The image provides a visual representation of the population distribution and composition in the United States in 1900, highlighting areas with higher and lower population densities. The map serves as a valuable resource for understanding demographic trends and patterns during that time period.
Amazon Nova
Created by amazon.nova-lite-v1:0 on 2025-06-07
The image is a map titled "Extent of the Negro Problem" from the Census of 1900. The map shows the composition and distribution of the population in the United States, with a focus on the African American population. The map is divided into different sections, each representing a different range of African American population density. The map is color-coded, with darker shades of brown representing higher population densities. The map also includes a legend that explains the color coding and provides information on the population density of each section. The map is an example of how racial and ethnic data was collected and represented in the early 20th century.
Created by amazon.nova-pro-v1:0 on 2025-06-07
The image shows a map of the United States with the title "Extent of the Negro Problem: Social Conditions, United States Census of 1900". The map is divided into different regions, with each region representing the density of the Negro population in that area. The map also includes a legend that explains the different colors used to represent the population density. The map is a historical document that provides insight into the social conditions of the Negro population in the United States during the early 20th century.
Google Gemini
Created by gemini-2.0-flash on 2025-06-03
Here's a description of the image:
The image is a historical map of the United States, titled "Extent of the Negro Problem, Social Conditions, United States, Census of 1900: Composition and Distribution of Population". It visually represents the "Density of Negro Population" in the United States, presumably based on data from the 1900 census.
The map is overlaid with a color-coded key that indicates the density of the Black population per square mile. The color intensity varies, likely representing different ranges of population density (e.g., lighter shades indicating sparse populations, and darker shades indicating dense populations). The southern states are shaded in the darkest colors.
Created by gemini-2.0-flash-lite on 2025-06-03
Here's a description of the image:
Overview:
The image is a map showing the density of the Negro population in the United States, as of the 1900 Census. It's titled "Extent of the Negro Problem" which reflects the historical context and biases of the time.
Map Features:
- Area of Focus: The map focuses on the continental United States.
- Color Coding:
- A color gradient (from light orange to dark red) likely indicates the density of the Negro population per square mile.
- Lighter shades represent lower densities, and darker shades indicate higher densities.
- Distribution:
- The map shows a significant concentration of the Negro population in the southeastern United States, with the darkest areas indicating the highest densities.
- There are also some concentrations in the Midwest and the West.
- Other areas have lower density or negligible populations.
- Additional Elements:
- The map includes the title, "Composition and Distribution of Population."
- A legend (likely to the lower left) explains the color coding.
- The mapmaker’s credit might be at the bottom (though obscured).
Historical Context:
- The title reflects the social context of the early 20th century, where the "Negro Problem" was a common phrase used to discuss the racial dynamics and challenges of the time.
- This map provides insights into patterns of racial segregation and population distribution in the United States at the beginning of the 20th century, a time of significant racial inequality.
If you would like, provide me with another image.
Mistral Pixtral
Created by us.mistral.pixtral-large-2502-v1:0 on 2025-06-05
The image is a historical map from the United States Census of 1900, depicting the "Extent of the Negro Problem" in terms of the composition and distribution of the African American population across the country. The map uses shading to indicate the density of the African American population in different regions.
Key details include:
Title and Context:
- The map is titled "Extent of the Negro Problem" and falls under the category of "Social Conditions, United States Census of 1900."
- It focuses on the "Composition and Distribution of Population."
Geographical Coverage:
- The map covers the entire United States, including Alaska and Hawaii.
Color Coding:
- Different shades of orange and red are used to represent the density of the African American population.
- The key at the bottom left corner explains the shading:
- Light orange: Less than 10% of the population.
- Medium orange: 10-25% of the population.
- Dark orange: 25-50% of the population.
- Red: Over 50% of the population.
Population Distribution:
- The highest concentrations of African American populations (shown in dark orange and red) are primarily in the Southeastern United States, particularly in states like Mississippi, Alabama, Georgia, and South Carolina.
- Moderate concentrations (medium orange) are seen in adjacent regions and some parts of the Midwest.
- Lower concentrations (light orange) are scattered throughout the rest of the country, with minimal presence in the Western states and parts of the Northeast.
Additional Information:
- The map was prepared under the direction of Walter F. Willcox, Chief Statistician for Population, and was printed by the Norwood Litho. Co., Brooklyn, N.Y.
This map provides a visual representation of the demographic landscape of the African American population in the United States at the turn of the 20th century, highlighting significant regional variations in population density.
Qwen
Created by Qwen/Qwen2.5-VL-7B-Instruct on 2025-07-11
The image is a historical map titled "Extent of the Negro Problem: Social Conditions, United States, Census of 1900," which focuses on the composition and distribution of the African American population in the United States during the 20th century. The map uses color gradients to represent the density of African American population across different regions of the country.
- Light yellow/orange shades represent lower densities of the African American population, typically indicating areas with fewer African Americans.
- Darker shades of orange and red indicate higher densities, suggesting areas with a larger concentration of the African American population.
The map is divided into states and counties, giving a clear geographical distribution of the African American population based on the 1900 census data. The territory of Alaska and Hawaii is not included in this map, reflecting the geopolitical context of the early 20th century.
The map is a historical artifact that provides a visual representation of the racial demographic landscape of the United States as it was at the turn of the 20th century.
Created by Qwen/Qwen2.5-VL-72B-Instruct on 2025-07-11
This image is a historical map titled "Extent of the Negro Problem: Social Conditions, United States. Census of 1900." It focuses on the composition and distribution of the African American population in the United States based on the 1900 census data. The map uses various shades of orange to indicate the density of the African American population across different regions.
The densest concentrations of the African American population are shown in the southeastern states, particularly in areas such as Mississippi, Alabama, Georgia, and South Carolina. The shading becomes lighter as you move westward and northward, indicating a lower density of the African American population in those regions.
The map also includes a legend in the bottom left corner that provides a scale for interpreting the shades of orange, helping to understand the population density in each area. The map is overlaid with a grid system for geographical reference.
Text analysis
Amazon