Machine Generated Data
Tags
Color Analysis
Categories
Imagga
created on 2019-06-04
| text visuals | 99.3% | |
Captions
Microsoft
created by unknown on 2019-06-04
| a screen shot of a computer | 82.1% | |
| a screen shot of a computer screen with text | 81.3% | |
| a screen shot of a book | 60.9% | |
Clarifai
Created by general-english-image-caption-clip on 2025-07-13
a map of the distribution of the population.
Salesforce
Created by general-english-image-caption-blip on 2025-05-28
a photograph of a large display of a number of graphs
Created by general-english-image-caption-blip-2 on 2025-07-05
a large sheet of paper with different types of data
OpenAI GPT
Created by gpt-4o-2024-11-20 on 2025-06-11
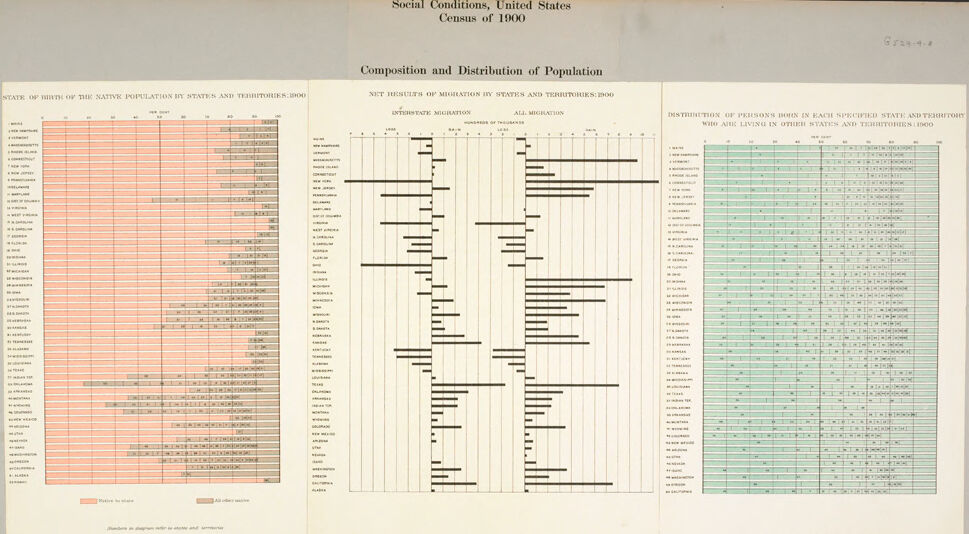
This is a statistical graphic document titled "Social Conditions, United States Census of 1900: Composition and Distribution of Population." It is divided into three sections, each presenting data and charts related to migration and population distribution, likely compiled from the 1900 census.
Left Panel (Peach and Gray Tones):
- This section presents data on "The State of Birth of the Native Population in States and Territories - 1900." It appears to be a grid-based chart listing U.S. states and territories on the y-axis, showing comparative details about where the population was born.
- The use of peach and gray tones differentiates between "Natives to State" and "All Other Natives."
Middle Panel (Bar Graphs):
- The middle section is focused on migration trends and shows "Net Results of Migration by States and Territories - 1900." There are black bar graphs indicating migration data, with labels highlighting whether people moved in or out of a particular location.
- It includes categories such as "All Migration," further broken into subcategories, covering specific states and territories.
Right Panel (Blue and White Grid):
- This section outlines "Distribution of Persons Born in Each Specified State and Territory Who Are Living in Other States and Territories - 1900." It lists data for each state or territory in a layered grid format with numerical tabulations of where populations born in one state have moved to.
Overall, this document serves as a visual representation of U.S. population dynamics in 1900, emphasizing birth origins, migration trends, and movement between states. The design uses a combination of textual data, colored grids, and bar charts, reflecting historical demographic insights from the census.
Created by gpt-4o-2024-08-06 on 2025-06-11
The image is a historical data visualization from the 1900 United States Census titled "Composition and Distribution of Population". It is divided into three sections, each presenting different statistical information about the population at that time.
Left Section:
- Titled "State of Birth of the Native Population in States and Territories: 1900".
- This section uses a series of horizontal bar charts, shaded primarily in red, to depict the state of birth for the population across various states and territories.
- Each row represents a state or territory, and the length of each bar corresponds to the number of individuals born in that location.
- There are two color shades used, one likely representing the native-born population and the other for individuals born in other states or territories.
Middle Section:
- Titled "Net Results of Migration by States and Territories: 1900".
- This section features vertical black bars to show net migration results.
- Each bar represents whether there was a net gain or loss of population for each state and territory due to migration.
- The bars extend either left or right from a central axis, indicating whether the movement was inward or outward.
Right Section:
- Titled "Distribution of Persons Born in Each Specified State and Territory who are Living in Other States and Territories: 1900".
- Presented as a table, this section lists states and territories along with data of where individuals born in those states/territories were residing in 1900.
- The table is color-coded in green and includes numerical data showing distribution patterns.
Overall, the image presents complex demographic data in a visual format to illustrate migration patterns, birth origins, and distribution of the population in the United States in 1900.
Anthropic Claude
Created by anthropic.claude-3-haiku-20240307-v1:0 on 2025-06-18
This image appears to be a statistical chart or table from the 1900 United States Census. It contains information on the composition and distribution of the population, including details on the state of birth of the native population and net results of migration by state and territory. The chart uses a combination of numerical data and graphical elements to present this demographic information in a structured format.
Created by us.anthropic.claude-3-5-sonnet-20241022-v2:0 on 2025-06-18
This image appears to be a statistical chart from the 1900 United States Census titled "Social Conditions, United States Census of 1900" focusing on "Composition and Distribution of Population." The chart contains multiple sections with different visualizations:
- A large color-coded bar chart showing state-by-state data, with bars in pink and turquoise colors
- A section showing "State of Birth of the Native Population by States and Territories: 1900"
- A section on "Net Results of Migration in States and Territories: 1900" with horizontal bar graphs showing population movement
- A section showing "Distribution of Persons Born in Each Specified State and Territory"
The chart uses various visualization techniques including horizontal bars, color coding, and comparative data presentation to show population distribution and migration patterns across different states and territories in the United States at the turn of the 20th century. The layout is typical of historical census documents, with detailed statistical information presented in a formal, structured manner.
Meta Llama
Created by us.meta.llama3-2-11b-instruct-v1:0 on 2025-06-03
The image presents a collection of three tables, each providing detailed information on the composition and distribution of the population in the United States as of 1900. The tables are organized in a clear and concise manner, making it easy to understand the data presented.
Table 1: State of Birth of the Native Population in States and Territories, 1900
- This table provides information on the state of birth of the native population in states and territories in 1900.
- It lists the states and territories, along with the number of individuals born in each state or territory who were living in other states or territories in 1900.
- The table also includes columns for the total population of each state or territory and the percentage of the population that was born in that state or territory.
Table 2: Net Results of Migration in States and Territories, 1900
- This table presents the net results of migration in states and territories in 1900.
- It lists the states and territories, along with the number of individuals who migrated into each state or territory and the number of individuals who migrated out of each state or territory.
- The table also includes columns for the net gain or loss of population in each state or territory due to migration.
Table 3: Distribution of Persons Born in Each Specified State and Territory Who Are Living in Other States and Territories, 1900
- This table provides information on the distribution of persons born in each specified state and territory who are living in other states and territories in 1900.
- It lists the states and territories, along with the number of individuals born in each state or territory who were living in other states or territories in 1900.
- The table also includes columns for the total population of each state or territory and the percentage of the population that was born in that state or territory.
Overall, the image provides a comprehensive overview of the composition and distribution of the population in the United States as of 1900. The tables offer valuable insights into the migration patterns, population growth, and demographic characteristics of the country at that time.
Created by us.meta.llama3-2-90b-instruct-v1:0 on 2025-06-03
This image presents a collection of three charts from the 1900 United States Census, focusing on the social conditions of the population. The charts are arranged in a horizontal row, with the first chart on the left displaying the state of birth of the native population in states and territories. The second chart in the middle illustrates the net results of migration in states and territories, while the third chart on the right shows the distribution of persons born in each specified state and territory who are living in other states and territories.
Each chart features a unique color scheme, with the first chart in red, the second in black and white, and the third in green. The charts are set against a beige background, which provides a neutral contrast to the vibrant colors used in the charts. Overall, this image offers a visual representation of the demographic trends and migration patterns in the United States during the early 20th century.
Amazon Nova
Created by amazon.nova-lite-v1:0 on 2025-06-02
The image shows a document titled "Social Conditions, United States Census of 1900." The document appears to be a statistical report or data table, likely from a census or survey conducted in the United States in 1900. The document contains several sections, including:
"Composition and Distribution of Population": This section likely provides information on the demographic composition and distribution of the population in the United States during the 1900 census. It may include data on age, gender, race, occupation, and other demographic characteristics.
"State of Birth of the Native Population by States and Territories: 1900": This section likely presents data on the birthplace of the native-born population in the United States, categorized by states and territories. It may show the number or percentage of individuals born in each state or territory.
"Net Results of Migration by States and Territories: 1900": This section likely provides information on the net migration patterns within the United States during the 1900 census. It may show the number of individuals who moved from one state or territory to another, as well as the net gain or loss of population in each state or territory.
"Distribution of Persons Born in Each Specified State and Territory Who Are Living in Other States and Territories: 1900": This section likely presents data on the distribution of individuals who were born in a specific state or territory but are currently living in other states or territories. It may show the number or percentage of individuals who migrated from their birthplace to other locations.
The document appears to be a statistical report or data table, likely used for research, analysis, or policy-making purposes related to the social conditions and demographic characteristics of the United States during the 1900 census.
Created by amazon.nova-pro-v1:0 on 2025-06-02
The image shows a page from the United States Census of 1900, specifically focusing on the "Composition and Distribution of Population." This page contains three distinct sections, each with detailed statistical data presented in tables.
The first section is titled "State of Birth of the Native Population by States and Territories: 1900." This table lists states and territories in the left column, with corresponding data on the native population's birthplace. The data is color-coded: pink represents the native population, and brown represents the foreign-born population. The table includes both numerical values and percentages.
The second section is titled "Net Results of Migration by States and Territories: 1900." This table provides information on the migration patterns, showing the number of people who moved into and out of each state and territory. The data is presented in black lines, with the length of the lines indicating the magnitude of migration.
The third section is titled "Distribution of Persons Born in Each Specified State and Territory Who Are Living in Other States and Territories: 1900." This table shows the distribution of individuals born in one state or territory but living in another. The data is presented in a grid format with states and territories listed along the top and side, and the numbers within the grid indicate the number of people who have moved from one location to another.
Overall, the page provides a comprehensive overview of the population's composition and migration patterns in the United States as of the 1900 Census.
Google Gemini
Created by gemini-2.0-flash on 2025-05-29
Here is a description of the image:
This image shows a historical document from the Social Conditions section of the United States Census of 1900. It is titled "Composition and Distribution of Population" and contains three related charts: "State of Birth of the Native Population by States and Territories, 1900," "Net Results of Migration by States and Territories: 1900," and "Distribution of Persons Born in Each Specified State and Territory Who Are Living in Other States and Territories: 1900." The first chart on the left presents the birthplaces of the native population, divided by states and territories, using horizontal bars. The second chart in the middle, a bar graph, illustrates the net migration results for each state and territory, both in terms of interstate migration and overall migration. The final chart on the right displays the distribution of people born in each state and territory who were living in other states and territories in 1900, presented in a table-like format with small squares indicating the number of people.
Created by gemini-2.0-flash-lite on 2025-05-29
The image is a page from a census report, likely from the United States Census of 1900. It is titled "Composition and Distribution of Population." There are three main charts on the page.
The first chart, on the left, titled "State of Birth of the Native Population by States and Territories: 1900," is a horizontal bar chart displaying the number of people born in each state/territory. The bars are color-coded, with different colors for those living in the same state versus other states/territories.
The second chart, in the middle, is titled "Net Results of Migration by States and Territories: 1900." It shows two bar charts. One details "Interstate Migration" and the other is "All Migration" (presumably including international migration). The horizontal bars represent the net gain or loss of population through migration for each state/territory.
The third chart, on the right, is titled "Distribution of Persons Born in Each Specified State and Territory Who Are Living in Other States and Territories: 1900." It's a tabular chart showing the distribution of where people born in a specific state/territory lived. The rows are labeled with the birth state/territory, and the columns represent where they were living. The cells within the table likely indicate population numbers or proportions.
The overall layout is informative, aiming to provide a comprehensive view of population distribution, migration patterns, and where people were born relative to where they lived in the United States at the turn of the century.
Mistral Pixtral
Created by us.mistral.pixtral-large-2502-v1:0 on 2025-06-04
The image is a page from the 1900 United States Census, specifically focusing on "Social Conditions" and the "Composition and Distribution of Population." The page is divided into three main sections, each presenting different demographic data.
State of Birth of the Native Population in States and Territories, 1900 (Left Section):
- This section contains a table showing the number of native-born individuals in each state and territory of the United States, categorized by their state of birth.
- The states and territories are listed vertically, and the columns represent different states of birth.
- The data includes both male and female populations.
Net Results of Migration in States and Territories, 1900 (Middle Section):
- This section features a bar graph illustrating the net migration results for each state and territory.
- The graph is divided into two parts: "Interstate Migration" and "All Migration."
- Each bar represents the net gain or loss of population due to migration, with positive values indicating net gains and negative values indicating net losses.
- The states and territories are listed vertically, with corresponding bars showing the migration data.
Distribution of Persons Born in Each Specified State and Territory and Now Living in Other States and Territories, 1900 (Right Section):
- This section contains a table showing the distribution of individuals born in each specified state and territory but currently residing in other states and territories.
- The states and territories are listed vertically, and the columns represent different states and territories where these individuals are currently living.
- The data includes both male and female populations.
Overall, the image provides a detailed snapshot of the demographic distribution and migration patterns within the United States as recorded in the 1900 Census.
Qwen
No captions written
Text analysis
Amazon