Machine Generated Data
Tags
Color Analysis
Categories
Imagga
created on 2019-06-04
| text visuals | 99.6% | |
Captions
Microsoft
created by unknown on 2019-06-04
| a close up of a box | 58.4% | |
| close up of a box | 53.1% | |
| a close up of a sign | 53% | |
Clarifai
Created by general-english-image-caption-clip on 2025-07-13
a map of the area.
Salesforce
Created by general-english-image-caption-blip on 2025-05-21
a photograph of a map of a city with a map of the area
Created by general-english-image-caption-blip-2 on 2025-07-05
two maps of the city of new york, one showing the city and the other showing the
OpenAI GPT
Created by gpt-4o-2024-11-20 on 2025-06-10
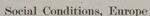
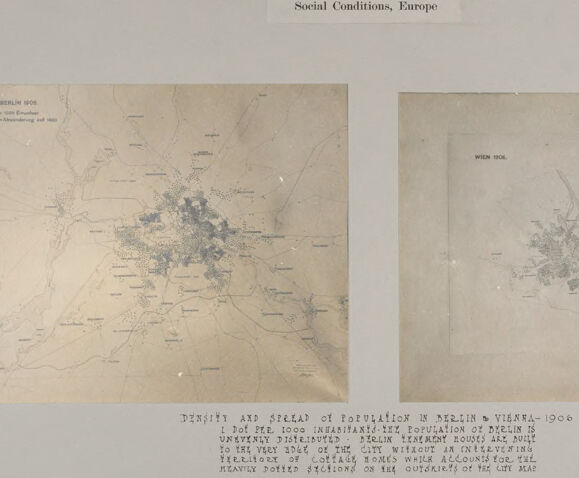
The image is a historical map comparison showing "Social Conditions, Europe." It features two separate maps side by side, representing Berlin and Vienna in 1906. Both maps highlight the density and spread of the population within these cities during that period. The Berlin map on the left showcases areas labeled with population clusters, and the Vienna map on the right similarly highlights population distribution and urban spread.
The text at the bottom explains the maps' purpose, stating:
"Density and spread of population in Berlin and Vienna—1906. For the 1906 inhabitants/population of Berlin is unevenly distributed from the very edge of the heavily-built suburbs!-
Created by gpt-4o-2024-08-06 on 2025-06-10
The image is a historical document displaying two maps side by side, titled "Social Conditions, Europe." On the left, there is a map titled "Berlin 1800 with Environs (Cholera regions are shade)" showing the city of Berlin and its surrounding areas, highlighting regions affected by cholera. On the right, there is a map titled "Wien 1800" depicting the city of Vienna and its surroundings.
The maps are part of a larger analysis concerning population distribution and density in Berlin and Vienna from the year 1900. The text below the maps explains that the population of Berlin at that time was denser compared to Vienna. The densely populated areas are related to zones affected by instances of cholera, indicating a correlation between population density and disease prevalence.
The document reflects an early 20th-century study of social conditions in European cities, particularly focusing on public health concerns in relation to urban populations.
Anthropic Claude
Created by anthropic.claude-3-haiku-20240307-v1:0 on 2025-06-14
The image appears to be a map showing the density and spread of population in Berlin and Vienna in 1906. The map on the left depicts the population density in Berlin, with darker areas indicating higher population concentrations. The map on the right shows a similar representation for Vienna. The text below the maps provides additional context, stating that the maps illustrate the "Density and Spread of Population in Berlin and Vienna - 1906" and that the "Density of Population is shown by the Shading of the Maps, the Darker Shading Indicating the More Densely Populated Areas."
Created by us.anthropic.claude-3-opus-20240229-v1:0 on 2025-06-14
The image shows two maps titled "Social Conditions, Europe" from 1904-1906. The maps depict Europe with various cities and regions marked by dots of different sizes and densities. The caption below the maps explains that the density and spread of the dots represent the intensity and extent of social unrest in Europe during that time period, with larger and denser dot clusters indicating greater social and revolutionary disturbances in those areas. The maps provide a visual representation of the social conditions and upheaval across different parts of Europe in the early 20th century.
Created by us.anthropic.claude-3-5-sonnet-20241022-v2:0 on 2025-06-14
This image shows two historical maps comparing the population density patterns of Berlin and Vienna in 1906. The maps appear to be in a muted, sepia-toned style typical of early 20th century cartography. The left map shows Berlin with a clear radial pattern of development spreading outward from the city center, while the right map depicts Vienna with its development pattern influenced by geographical features including what appears to be the Danube River. Below the maps is text explaining the density and spread of population in these cities. The title at the top reads "Social Conditions, Europe" suggesting these maps were part of a larger study or presentation about European urban development in the early 1900s. The maps effectively illustrate how these two major European capitals had different patterns of urban growth and population distribution.
Meta Llama
Created by us.meta.llama3-2-11b-instruct-v1:0 on 2025-06-10
The image presents a historical document titled "Social Conditions, Europe" and features two maps of Berlin and Vienna from 1906. The document is dated 1906 and includes a detailed description of the population density of each city.
Map of Berlin
- The map of Berlin is located on the left side of the image.
- It displays the population density of Berlin in 1906, with darker areas indicating higher population densities.
- The map also shows the location of major landmarks, such as the Berlin Wall and the Brandenburg Gate.
Map of Vienna
- The map of Vienna is located on the right side of the image.
- It displays the population density of Vienna in 1906, with darker areas indicating higher population densities.
- The map also shows the location of major landmarks, such as the Vienna State Opera and the Hofburg Palace.
Description of Population Density
- The document includes a detailed description of the population density of each city.
- The description states that the population density of Berlin was approximately 1,500 people per square kilometer, while the population density of Vienna was approximately 1,200 people per square kilometer.
- The description also notes that the population density of Berlin was higher in the western part of the city, while the population density of Vienna was higher in the central part of the city.
Conclusion
The image provides a historical snapshot of the population density of Berlin and Vienna in 1906. The maps and description offer valuable insights into the urban planning and development of these two major European cities during this time period.
Created by us.meta.llama3-2-90b-instruct-v1:0 on 2025-06-10
The image appears to be a page from an old book or document, featuring two maps of Berlin and Vienna in 1906. The title "Social Conditions, Europe" is displayed at the top, with the maps positioned below it.
Map Details:
- The left map shows Berlin, while the right map depicts Vienna.
- Both maps are rendered in black and white, with various lines and markings indicating different areas or features.
- The maps appear to be hand-drawn or printed on aged paper, giving them a vintage look.
Text Below the Maps:
- A paragraph of text is written below the maps, but it is difficult to read due to its small size and faded ink.
- The text appears to discuss the spread of population in Berlin and Vienna during 1906.
Background:
- The background of the image is a light gray color, which helps to highlight the maps and text.
- There are some faint marks and stains on the background, suggesting that the image may have been scanned or photographed from an original document.
Overall, the image provides a glimpse into the social conditions of Europe in the early 20th century, specifically focusing on the population distribution in Berlin and Vienna.
Amazon Nova
Created by amazon.nova-lite-v1:0 on 2025-06-09
This image shows a page from a book or report titled "Social Conditions, Europe." The page contains two maps, one labeled "Berlin 1906" and the other labeled "Vienna 1906." The maps illustrate the density and spread of population in the cities of Berlin and Vienna during the year 1906. The text below the maps explains that the population of Berlin and Vienna was heavily distributed in the outlying areas, with many people living in cottage homes and tenements. The maps and text provide insights into the urban living conditions and social dynamics of these two major European cities during the early 20th century.
Created by amazon.nova-pro-v1:0 on 2025-06-09
The image shows two maps of Berlin and Vienna. The maps are placed on a white background, and the title of the image is "Social Conditions, Europe." The maps are made of paper and have a sepia tone. The Berlin map is on the left, and the Vienna map is on the right. The maps are surrounded by a white border. The maps show the density and spread of the population in Berlin and Vienna in 1906.
Google Gemini
Created by gemini-2.0-flash on 2025-05-27
Here's a description of the image:
The image is a document showcasing two maps side by side. The one on the left is labeled "BERLIN 1906", and the one on the right is labeled "WIEN 1906" (Vienna). Both maps appear to depict the density and spread of population, with darker areas possibly indicating higher population densities. The maps themselves have the appearance of being old, with a faded look and possibly handwritten labels.
Below the maps, there's a typed text that seems to describe the data presented. It mentions "DENSITY AND SPREAD OF POPULATION IN BERLIN & VIENNA-1906" and notes that the population of Berlin is unevenly distributed.
The overall document has the title "Social Conditions, Europe" at the top, and a numerical code "G-529-200-3" in the upper right corner. This suggests the document is part of a larger collection or study on social conditions in Europe.
Created by gemini-2.0-flash-lite on 2025-05-27
Here's a description of the image:
The image is a historical cartographic representation, likely a print or map, focusing on social conditions in Europe. It appears to be a comparison of population density and spread in two major European cities: Berlin and Vienna, dating back to 1906.
Key features:
- Layout: The image is divided into two main sections, each containing a map.
- Maps: The maps depict the urban layouts of Berlin and Vienna, with areas of denser population marked. The city layouts show roads, bodies of water, and outlines of built-up areas.
- Labels: Each map is labeled. The labels are in the upper left of the Berlin map, which include the year "1906" and the text. The Vienna map has "WIEN 1906" and another text label at the top.
- Title and Descriptive Text: In the middle, between the maps is the title: "DENSITY AND SPREAD OF POPULATION IN BERLIN & VIENNA - 1906". A descriptive paragraph is printed below the title, providing context about the population distribution in the two cities. It states that population in Berlin is unevenly distributed.
- Overall appearance: The image is monochromatic, likely printed in black and white or grayscale. The paper has a slightly aged appearance.
In essence, the image provides a comparative visual analysis of urban population distribution at the turn of the 20th century.
Mistral Pixtral
Created by us.mistral.pixtral-large-2502-v1:0 on 2025-06-06
The image consists of two maps and accompanying text, illustrating the density and spread of population in Berlin and Vienna in 1906. The title at the top reads "Social Conditions, Europe."
Left Map: Berlin 1906
- Title: BERLIN 1906
- Scale: 1:100,000
- Description: This map shows the population density in Berlin. The darker shaded areas represent regions with higher population density. The map indicates that the population was concentrated in the central parts of the city, with the density decreasing as you move towards the outskirts.
Right Map: Vienna 1906
- Title: WIEN 1906
- Scale: 1:100,000
- Description: This map depicts the population density in Vienna. Similar to the Berlin map, the darker shaded areas indicate higher population density. The densest areas are concentrated around the city center, with a gradual decrease in density towards the outer regions.
Text Below the Maps
The text provides an analysis of the population distribution in both cities:
- Berlin: The text notes that the population was spread out in a circular fashion, with the highest density in the city center. It mentions that the density decreased uniformly as one moved outward, with no significant interruptions.
- Vienna: The text describes a similar pattern of population density, with the densest areas in the central parts of the city and a gradual decrease towards the outskirts. It also mentions that the densest sections are heavily dotted on the outskirts of the city map.
Overall, the image provides a comparative visual and textual analysis of population density and spread in Berlin and Vienna in the year 1906.
Qwen
Created by Qwen/Qwen2.5-VL-7B-Instruct on 2025-07-08
The image appears to be a page from a historical document or publication titled "Social Conditions, Europe." It contains two maps, one labeled "Berlin" and the other "Vienna," both dated 1906. The maps show the density and spread of population for the cities. The text below the maps explains that the population of Berlin is "unevenly distributed," with "Berlin tenement houses are built to the very edge of the city without an intervening parklike belt of cottage homes," which allows for the "heavy dot piling on the outskirts of the city map." The maps illustrate this description, showing the concentration of dots (likely representing population density) near the outskirts of each city.
Created by Qwen/Qwen2.5-VL-72B-Instruct on 2025-07-08
This image is a scanned page from a document discussing the "Social Conditions, Europe," focusing on population density and spread in Berlin and Vienna in 1906. The page includes two maps:
The map on the left represents Berlin. It shows a detailed layout of the city with the highest population density concentrated in the central area, depicted by a darker shaded region. Surrounding areas show a lower population density with more scattered settlements. The map includes various lines and markings, likely representing roads, boundaries, or other geographical features.
The map on the right represents Vienna. Similar to the Berlin map, it shows a concentration of population in the central area, with the density decreasing as you move outward. The map also includes lines and markings, representing infrastructure or geographical features.
Below the maps, there is a block of text providing additional context. It mentions that the population of Berlin is unevenly distributed, with tenement houses built to the very edge of the city without an intervening belt of cottage homes. This text likely elaborates on the social and urban planning conditions of the time.
The overall presentation suggests a historical analysis of urban development and population distribution in these two major European cities during the early 20th century.
Text analysis
Amazon