Machine Generated Data
Tags
Color Analysis
Feature analysis
Amazon
Clarifai

AWS Rekognition
| Bird | 74.6% | |


Categories
Imagga
created on 2019-06-05
| text visuals | 99.3% | |
Captions
Microsoft
created by unknown on 2019-06-05
| a close up of a map | 67.5% | |
| close up of a map | 62.4% | |
| a map with text | 49.8% | |
Clarifai
No captions written
Salesforce
Created by general-english-image-caption-blip-2 on 2025-07-07
composition of food materials, by james mcclelland, 1884
Created by general-english-image-caption-blip on 2025-05-03
a photograph of a poster of a variety of vegetables and vegetables
OpenAI GPT
Created by gpt-4o-2024-11-20 on 2025-06-08
This is a nutrition chart titled "Composition of Food Materials," likely from the early 20th century, detailing the components of various types of meat, both fresh and cured. It is presented by the U.S. Department of Agriculture and was revised by C.F. Langworthy, an expert in Nutrition Investigations.
The chart analyzes the edible portions of five types of meat (lamb chop, pork chop, smoked ham, beef steak, and dried beef) by breaking down their nutritional composition into five elements: protein, fat, carbohydrates, ash, and water. Each component is represented by color-coded segments (red for protein, yellow for fat, orange for carbohydrates, brown for ash, and green for water). Additionally, the fuel value (calories per pound) is shown in black for each type of meat.
Here are the details for each meat represented:
Lamb Chop:
- Water: 53.1%
- Protein: 17.6%
- Fat: 28.3%
- Ash: 1.0%
- Fuel Value: 1475 calories per pound
Pork Chop:
- Water: 52.0%
- Protein: 16.9%
- Fat: 30.1%
- Ash: 1.0%
- Fuel Value: 1535 calories per pound
Smoked Ham:
- Water: 40.3%
- Protein: 16.1%
- Fat: 38.8%
- Ash: 4.8%
- Fuel Value: 1875 calories per pound
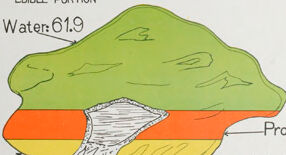
Beef Steak:
- Water: 61.9%
- Protein: 18.6%
- Fat: 18.5%
- Ash: 1.0%
- Fuel Value: 1090 calories per pound
Dried Beef:
- Water: 54.3%
- Protein: 30.0%
- Fat: 6.6%
- Ash: 9.1%
- Fuel Value: 810 calories per pound
The visual representations show cuts of meat with segmented color bands, making the nutritional breakdown easy to read at a glance. This chart serves as an informative guide for better understanding the nutritional composition and caloric value of meat products.
Created by gpt-4o-2024-08-06 on 2025-06-08
The image is a chart titled "Composition of Food Materials," which compares the nutritional content of different types of meat: lamb chop, pork chop, smoked ham, beef steak, and dried beef. It is prepared by the U.S. Department of Agriculture's Office of Experiment Stations, with A.C. True as Director and C. F. Langworthy as the expert responsible for nutrition investigations.
The chart uses color-coded sections to show the relative proportion of different nutritional components in each type of meat. The components are represented with the following colors:
- Red for protein
- Yellow for fat
- Pink for carbohydrates
- Gray for ash
- Green for water
Each type of meat is depicted as an illustrated section, with colors corresponding to each component and labels indicating the percentage or amount of each component per pound:
- Lamb Chop: Contains 17.6% protein, 28.3% fat, 1.0% ash, and 53.1% water, with a fuel value of 1,475 calories per pound.
- Pork Chop: Contains 16.9% protein, 30.1% fat, 1.0% ash, and 52.0% water, with a fuel value of 1,535 calories per pound.
- Smoked Ham: Contains 16.1% protein, 38.8% fat, 4.8% ash, and 40.3% water, with a fuel value of 1,875 calories per pound.
- Beef Steak: Contains 18.6% protein, 18.5% fat, 1.0% ash, and 61.9% water, with a fuel value of 1,090 calories per pound.
- Dried Beef: Contains 30.0% protein, 6.6% fat, 9.1% ash, and 54.3% water, with a fuel value of 810 calories per pound.
The chart visually represents each meat type with a graphical shape and layers to demonstrate the proportion of each component in the composition. The rectangles filled with black represent the calorie content per pound for easy comparison of fuel value.
Anthropic Claude
Created by anthropic.claude-3-haiku-20240307-v1:0 on 2025-06-12
The image appears to be a chart titled "Composition of Food Materials" from the U.S. Department of Agriculture. It provides a visual breakdown of the nutritional composition of various meat products, including lamb chop, pork chop, smoked ham, beef steak, and dried beef. The chart displays the percentages of protein, fat, carbohydrates, ash, and water content for each meat item, as well as the fuel value or calorie content per pound. The information is presented in a clear and organized manner using illustrations and numerical data.
Created by us.anthropic.claude-3-opus-20240229-v1:0 on 2025-06-12
The image shows a chart titled "Composition of Food Materials" prepared by C.F. Langworthy, an expert in charge of nutrition investigations at the U.S. Department of Agriculture Office of Experiment Stations. The chart provides a breakdown of the protein, fat, carbohydrate, ash, and water content, as well as fuel value in calories, for various meat products including lamb chop, pork chop, smoked ham, beef steak, and dried beef. The composition is visually represented using colored sections for each component, allowing for easy comparison between the different meat products.
Created by us.anthropic.claude-3-5-sonnet-20241022-v2:0 on 2025-06-12
This is a vintage nutritional chart titled "Composition of Food Materials" from the U.S. Department of Agriculture's Office of Experiment Stations. It shows the nutritional breakdown of different meat products, both fresh and cured.
The chart displays five different meat cuts:
- Lamb Chop
- Pork Chop
- Smoked Ham
- Beef Steak
- Dried Beef
Each meat cut is illustrated with a diagram showing its composition through color coding:
- Red represents Protein
- Yellow represents Fat
- Light blue represents Carbohydrates
- Brown represents Ash
- Green represents Water
- Black blocks show Fuel Value
The chart includes specific percentages for each component and calories per pound. For example:
- Smoked Ham has the highest calories at 1875 per pound
- Dried Beef has the highest protein content at 30.0%
- Smoked Ham has the highest fat content at 38.8%
The chart appears to be hand-drawn and colored, likely from the early 1900s based on its style and the credited director A.C. True and nutritionist C.F. Langworthy.
Meta Llama
Created by us.meta.llama3-2-90b-instruct-v1:0 on 2025-05-26
This image presents a comprehensive chart illustrating the composition of various food materials, specifically focusing on meat. The chart is divided into sections, each representing a different type of meat: lamb chop, pork chop, smoked ham, beef steak, and dried beef.
Visual Representation:
- Each section features a colorful illustration of the corresponding meat cut, with distinct colors representing different components such as protein, fat, carbohydrates, ash, and water.
- The illustrations are accompanied by detailed labels and numerical values, providing a clear breakdown of the nutritional content of each meat type.
Key Findings:
- The chart reveals that lamb chops have the highest protein content (17.6%), while pork chops have the lowest (16.9%).
- Smoked ham has the highest fat content (38.8%), whereas beef steak has the lowest (18.5%).
- Dried beef has the highest ash content (9.1%), indicating a higher mineral content compared to other meats.
Conclusion:
This chart offers a valuable resource for individuals seeking to understand the nutritional profiles of various meats. By examining the composition of each meat type, consumers can make informed decisions about their dietary choices and ensure they are meeting their nutritional needs.
Created by us.meta.llama3-2-11b-instruct-v1:0 on 2025-05-26
The image presents a comprehensive chart titled "Composition of Food Materials," which provides detailed information on the nutritional content of various food items. The chart is divided into sections, each representing a different type of food, and includes data on protein, fat, carbohydrates, ash, and water content.
Here is a structured breakdown of the chart:
- Title: "Composition of Food Materials"
- Subtitle: "U.S. Department of Agriculture Office of Experiment Stations A.C. True: Director"
- Prepared by: C.F. Langworthy, Expert in Charge of Nutrition Investigations
- Food Types:
- Lamb Chop
- Pork Chop
- Smoked Ham
- Beef Steak
- Dried Beef
- Nutritional Data:
- Protein: percentage of protein content
- Fat: percentage of fat content
- Carbohydrates: percentage of carbohydrate content
- Ash: percentage of ash content
- Water: percentage of water content
- Fuel Value: calories per pound
- Visual Representation:
- Each food type is represented by a diagram showing the relative proportions of protein, fat, carbohydrates, ash, and water.
- The diagrams are color-coded to match the corresponding sections in the chart.
In summary, the chart provides a clear and concise overview of the nutritional composition of various food items, making it a useful resource for individuals looking to make informed decisions about their diet.
Amazon Nova
Created by amazon.nova-pro-v1:0 on 2025-05-26
The image is a chart titled "Chart 3. Meat Fresh and Cured," which provides information about the composition of food materials. The chart is divided into sections, each representing a different type of meat. The chart includes a legend at the top that explains the colors used to represent different components of the meat, such as protein, fat, carbohydrates, ash, and water. The chart also includes the fuel value of each type of meat, which is measured in calories per pound. The chart is a useful tool for understanding the nutritional content of different types of meat.
Created by amazon.nova-lite-v1:0 on 2025-05-26
This image is a chart from the U.S. Department of Agriculture, Office of Experiment Stations, showing the composition of various types of meat. The chart is titled "Composition of Food Materials" and was prepared by C.F. Langworthy, an expert in charge of nutrition investigations. It includes information on the nutritional content of different meats, such as lamb chop, pork chop, smoked ham, beef steak, and dried beef. The chart provides details on the amount of protein, fat, carbohydrates, ash, and water in each type of meat, as well as the fuel value and calories per pound. The chart is divided into sections for each type of meat, with the nutritional information presented in a clear and organized manner.
Google Gemini
Created by gemini-2.0-flash on 2025-04-30
Certainly! Here's a description of the image based on the provided context:
Overall Description:
The image shows a vintage chart titled "Chart 3. Meat Fresh and Cured" from the U.S. Department of Agriculture. It's a diagram illustrating the composition of different types of meat (lamb chop, pork chop, smoked ham, beef steak, and dried beef) in terms of protein, fat, carbohydrates, ash, and water content. The chart is a "Revised Edition" and credits C.F. Langworthy as the Expert in Charge of Nutrition Investigations.
Key elements:
Title and Information: The chart title, department information, and preparation credits are at the top.
Composition Legend: A color-coded legend is present showing what each color represents:
- Red = Protein
- Yellow = Fat
- [Missing Color] = Carbohydrates (appears to be left blank)
- [Missing Color] = Ash (appears to be left blank)
- Green = Water
Meat Diagrams: Simplified, colorful depictions of each type of meat are shown. The areas within each meat diagram are colored to represent the proportions of protein, fat, water, and ash.
Percentage Breakdown: Next to each meat illustration, the percentage of water, protein, fat, and ash is noted.
Fuel Value: Each meat illustration also has a square labeled "Fuel Value" and an associated calorie count per pound.
Overall Impression:
The chart is an old-fashioned visual aid designed to show the nutritional makeup of various meats, likely intended for educational purposes or for those interested in dietary information. The style of illustration and color scheme are typical of the time period it was created in.
Created by gemini-2.0-flash-lite on 2025-04-30
This is a vintage nutritional chart created by the U.S. Department of Agriculture, Office of Experiment Stations, and prepared by C.F. Langworthy. It's titled "Chart 3. Meat Fresh and Cured."
The chart provides a visual breakdown of the composition of different types of meat:
Color-coded Representation: It uses a color-coding system to represent the different components of each meat type:
- Green: Water content
- Red: Protein
- Yellow: Fat
- Other: Ash
Meat Types: It illustrates the composition of five different types of meat:
- Lamb Chop
- Pork Chop
- Smoked Ham
- Beef Steak
- Dried Beef
Data Points: For each meat type, the chart provides:
- The percentage of water, protein, fat, and ash.
- The fuel value (in calories per pound)
Overall Design: The chart has a simple, clear, and informative design, using drawings of the meat to help illustrate the components. The text is concise and easy to understand. The chart has a classic, educational feel, characteristic of its era.
Mistral Pixtral
Created by us.mistral.pixtral-large-2502-v1:0 on 2025-05-27
The image is a detailed chart titled "Composition of Food Materials," specifically focusing on the nutritional composition of different types of meat. It is a revised edition prepared by C.F. Langworthy, an expert in charge of nutrition investigations under the U.S. Department of Agriculture, Office of Experiment Stations, directed by A.C. True.
The chart illustrates the composition of the edible portions of five types of meat:
Lamb Chop:
- Water: 53.1%
- Protein: 17.6%
- Fat: 28.3%
- Ash: 1.0%
- Fuel Value: 1475 calories per pound
Pork Chop:
- Water: 52.0%
- Protein: 16.9%
- Fat: 30.1%
- Ash: 1.0%
- Fuel Value: 1535 calories per pound
Smoked Ham:
- Water: 40.3%
- Protein: 16.1%
- Fat: 38.8%
- Ash: 4.8%
- Fuel Value: 1875 calories per pound
Beef Steak:
- Water: 61.9%
- Protein: 18.6%
- Fat: 18.5%
- Ash: 1.0%
- Fuel Value: 1090 calories per pound
Dried Beef:
- Water: 54.3%
- Protein: 30.0%
- Fat: 6.6%
- Ash: 9.1%
- Fuel Value: 810 calories per pound
Each type of meat is visually represented with a color-coded diagram showing the proportions of protein (orange), fat (yellow), carbohydrates (light blue), ash (gray), and water (green). The fuel value for each meat type is indicated by a black square, representing the number of calories per pound, with 1 square inch equaling 1000 calories.
This chart provides a clear and comparative visual representation of the nutritional content and caloric value of various meat products.
Qwen
Created by Qwen/Qwen2.5-VL-7B-Instruct on 2025-07-17
This image is a chart from the U.S. Department of Agriculture's Office of Experiment Stations, prepared by C.F. Langworthy, an expert in charge of nutrition investigations. The chart is titled "Composition of Food Materials" and provides nutritional information for various types of meat, both fresh and cured. Each food item is depicted with a label indicating the edible portion and includes percentages of water, protein, fat, carbohydrates, and ash. Additionally, the fuel value is provided, with one square inch representing 1,000 calories.
The chart includes the following items:
Lamb Chop:
- Water: 53.1%
- Protein: 17.6%
- Fat: 28.3%
- Ash: 1.0%
- Fuel Value: 1,475 calories per pound
Pork Chop:
- Water: 52.0%
- Protein: 16.9%
- Fat: 30.1%
- Ash: 1.0%
- Fuel Value: 1,535 calories per pound
Smoked Ham:
- Water: 40.3%
- Protein: 16.1%
- Fat: 38.8%
- Ash: 4.8%
- Fuel Value: 1,875 calories per pound
Beef Steak:
- Water: 61.9%
- Protein: 18.6%
- Fat: 18.5%
- Ash: 1.0%
- Fuel Value: 1,090 calories per pound
Dried Beef:
- Water: 54.3%
- Protein: 30.0%
- Fat: 6.6%
- Ash: 9.1%
- Fuel Value: 810 calories per pound
The chart uses color coding to differentiate between the different components of the food materials, as follows:
- Red for Protein
- Yellow for Fat
- Light blue for Carbohydrates
- Brown for Ash
- Green for Water
Created by Qwen/Qwen2.5-VL-72B-Instruct on 2025-07-17
This image is a vintage USDA chart titled "Composition of Food Materials," specifically focusing on "Meat Fresh and Cured." It is a revised edition prepared by C.F. Langworthy, identified as an expert in charge of nutrition investigations, under the direction of A.C. True from the U.S. Department of Agriculture's Office of Experiment Stations.
The chart visually represents the nutritional composition of five different types of meat: Lamb Chop, Pork Chop, Smoked Ham, Beef Steak, and Dried Beef. Each meat is illustrated with its edible portion depicted as a green silhouette, while the various nutritional components are represented by different colored layers within the silhouette:
- Red for Protein
- Yellow for Fat
- Light blue for Carbohydrates
- Brown for Ash
- Green for Water
Additionally, there is a black section labeled "Fuel Value," which indicates the energy content of the meat in calories per pound. Each meat's nutritional content is quantified in terms of water, protein, fat, ash, and fuel value, with the respective percentages and calorie counts provided next to the illustrations.
For example:
- Lamb Chop: 53.1% water, 17.6% protein, 28.3% fat, 1.0% ash, 1475 calories per pound.
- Pork Chop: 52.0% water, 16.9% protein, 30.1% fat, 1.0% ash, 1535 calories per pound.
- Smoked Ham: 40.3% water, 16.1% protein, 38.8% fat, 4.8% ash, 1875 calories per pound.
- Beef Steak: 61.9% water, 18.6% protein, 18.5% fat, 1.0% ash, 1090 calories per pound.
- Dried Beef: 54.3% water, 30.0% protein, 6.6% fat, 9.1% ash, 810 calories per pound.
The chart serves as an educational tool, providing a clear and detailed breakdown of the nutritional composition of various meats, which would be useful for dietary planning and understanding the fuel value of different food materials.
Text analysis
Amazon