Machine Generated Data
Tags
Color Analysis
Feature analysis
Amazon
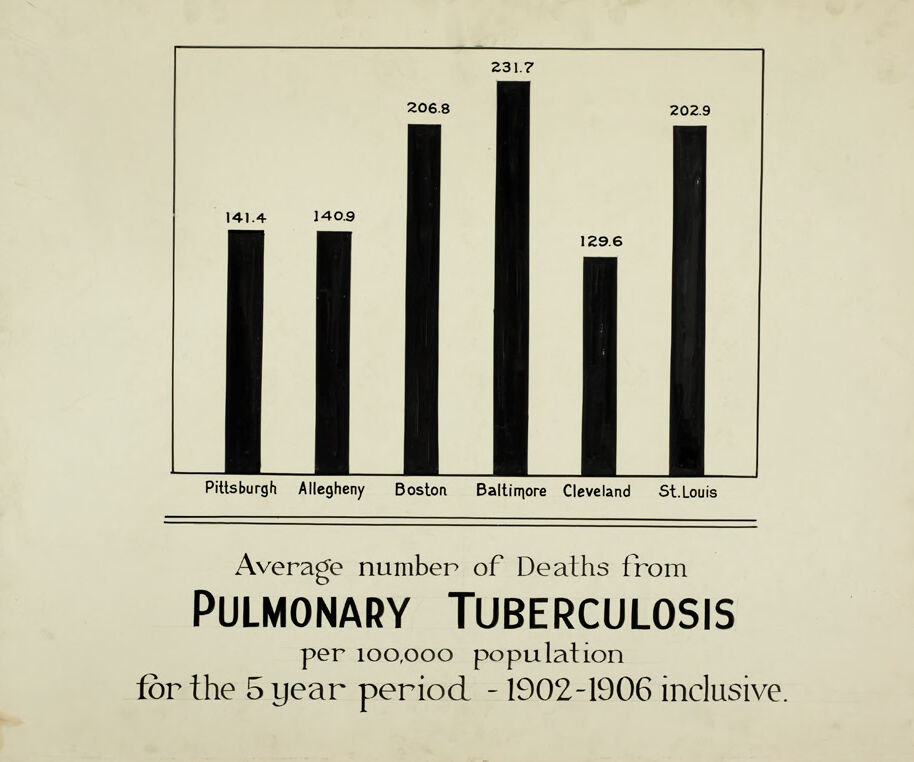
| Poster | 92.7% | |
Categories
Imagga
| streetview architecture | 54.4% | |
| interior objects | 43.9% | |
| paintings art | 1.1% | |
Captions
Microsoft
created on 2019-06-05
| a close up of a piece of paper | 81.9% | |
| a close up of a logo | 81.8% | |
| a piece of paper | 81.7% | |
Text analysis
Amazon