Machine Generated Data
Tags
Color Analysis
Feature analysis
Amazon
Clarifai
AWS Rekognition
| Rug | 80.9% | |

Categories
Imagga
created on 2019-06-07
| text visuals | 77.6% | |
| streetview architecture | 19% | |
| paintings art | 3% | |
Captions
Microsoft
created by unknown on 2019-06-07
| a close up of a piece of paper | 76.1% | |
| a screenshot of a cell phone | 72.4% | |
| a piece of paper | 72.3% | |
Salesforce
Created by general-english-image-caption-blip-2 on 2025-07-06
a bar chart showing the number of people who have died in the last year
Created by general-english-image-caption-blip on 2025-05-29
a photograph of a chart of the number of people in the world
OpenAI GPT
Created by gpt-4o-2024-11-20 on 2025-06-12
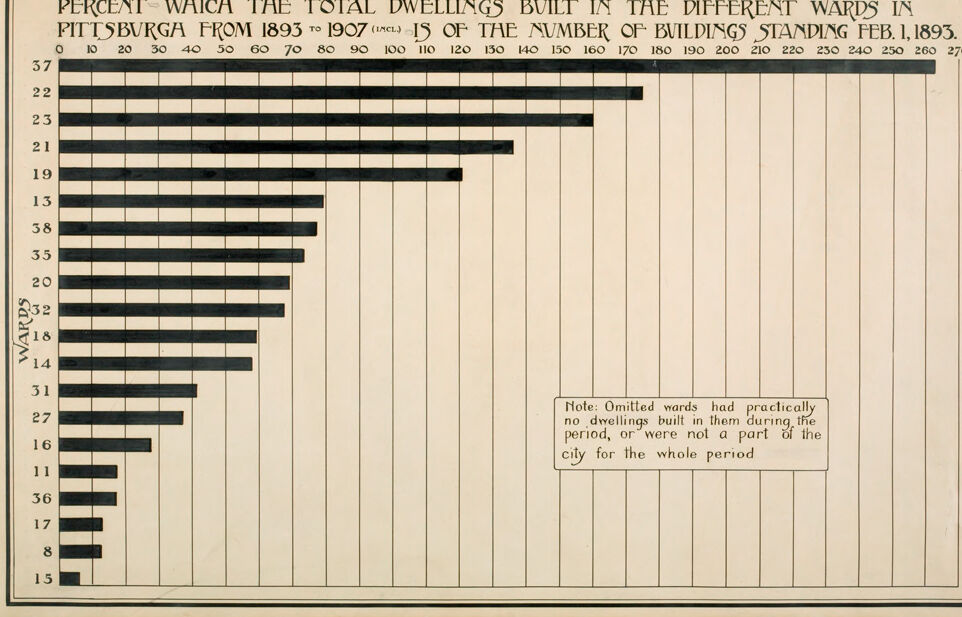
This image is a historical bar chart that displays the percentage of total dwellings built in various wards in Pittsburgh between 1893 and 1907. The chart compares these numbers to the total number of buildings standing as of February 1st, 1893.
Key Details:
Title/Heading:
The title at the top of the chart reads, "Percent Which the Total Dwellings Built in the Different Wards in Pittsburgh from 1893 to 1907 (Incl.) is of the Number of Buildings Standing Feb. 1, 1893."Structure:
- X-axis: Represents the percentage scale ranging from 0 to 270, indicating the proportion.
- Y-axis: Lists the ward numbers vertically, from 1 to 38.
Bars:
- Bars of varying lengths represent the percentage of total dwellings built in each specific ward during the specified period.
- Longer bars indicate wards with higher percentages of dwellings added compared to the structures that existed in 1893.
Observations:
- Ward "37" has the longest bar, showing it had the highest percentage of dwellings added relative to the existing stock in 1893.
- Additional wards such as 23, 21, and 19 also demonstrate significant construction growth during the period.
- Some wards, like "15" and "8," have almost no growth illustrated by the small or non-existing bars.
Note:
In the bottom-right corner, there's a clarification that certain wards are omitted from the chart because they had "practically no dwellings built in them during the period or were not a part of the city for the whole period."
This chart provides historical insight into urban development and housing expansion patterns in Pittsburgh during the late 19th and early 20th centuries.
Created by gpt-4o-2024-08-06 on 2025-06-12
The image is a bar chart that illustrates the percentage of total dwellings built in different wards of Pittsburgh from 1893 to 1907, in relation to the number of buildings standing on February 1, 1893. The chart is presented in a horizontal format with wards listed on the left side and a percentage scale running from 0 to 270 along the top, in increments of 10.
The wards are numbered and listed from top to bottom as follows: 37, 22, 23, 21, 19, 13, 38, 35, 32, 20, 18, 14, 31, 27, 16, 11, 36, 17, 8, 15. Each ward has a corresponding black horizontal bar of varying lengths that extends towards the right.
Across the chart, Ward 37 has the longest bar, indicating the highest percentage of dwelling construction relative to the standing buildings as of 1893. The percentage scale indicates that Ward 37 had a little beyond 240 percent increase, suggesting an increase in construction activity in that ward.
There is also a note at the bottom right of the chart that states: "Note: Omitted wards had practically no dwellings built in them during the period, or were not a part of the city for the whole period." This suggests that some wards were not included in the chart either due to lack of construction activity or changes in the city boundaries over the given period.
Anthropic Claude
Created by anthropic.claude-3-haiku-20240307-v1:0 on 2025-06-15
This image appears to be a historical chart or graph depicting the percentage of total dwellings built in the different wards of Pittsburgh, Pennsylvania from 1895 to 1907. The chart shows the relative percentage of buildings constructed in each ward over this time period, with the wards represented along the vertical axis and the percentages along the horizontal axis. The chart provides insight into the urban development and growth patterns of Pittsburgh during this period.
Created by us.anthropic.claude-3-5-sonnet-20241022-v2:0 on 2025-06-15
This is a horizontal bar chart showing the percentage of total dwellings built in different wards of Pittsburgh from 1893 to 1907, compared to the number of buildings standing on February 1, 1893. The chart is organized in descending order, with Ward 37 showing the highest percentage (around 270%) and Ward 15 showing the lowest. The data is presented in black bars against a light background with a grid pattern. There's a note at the bottom right explaining that omitted wards had practically no dwellings built during this period or were not part of the city for the whole period. The chart provides a clear visualization of the varying rates of construction and development across Pittsburgh's different wards during this 14-year period.
Meta Llama
Created by us.meta.llama3-2-11b-instruct-v1:0 on 2025-06-05
The image presents a bar graph illustrating the percentage of dwellings built in different wards in Pittsburgh from 1893 to 1907. The graph is divided into two sections: the left side lists the wards, while the right side displays the corresponding percentages.
Wards and Percentages:
- Ward 1: 37%
- Ward 2: 22%
- Ward 3: 25%
- Ward 4: 21%
- Ward 5: 19%
- Ward 6: 13%
- Ward 7: 38%
- Ward 8: 35%
- Ward 9: 20%
- Ward 10: 32%
- Ward 11: 18%
- Ward 12: 14%
- Ward 13: 31%
- Ward 14: 27%
- Ward 15: 16%
- Ward 16: 11%
- Ward 17: 36%
- Ward 18: 17%
- Ward 19: 8%
- Ward 20: 15%
Note:
- Omitted wards had practically no dwellings built in them during the period, or were not a part of the city for the whole period.
Background:
- The graph features a beige background with black text and bars.
- A thin black border surrounds the graph.
Overall:
- The graph provides a clear visual representation of the distribution of dwellings across different wards in Pittsburgh during the specified period.
- The data suggests that some wards had a significantly higher percentage of dwellings built compared to others.
- The note at the bottom of the graph clarifies that omitted wards did not contribute substantially to the overall data.
Created by us.meta.llama3-2-90b-instruct-v1:0 on 2025-06-05
This image presents a bar graph illustrating the percentage of dwellings built in various wards of Pittsburgh between 1893 and 1907. The graph features a beige background with black text and bars, accompanied by a note at the bottom right corner.
The x-axis is labeled "PERCENT WHICH THE TOTAL DWELLINGS BUILT IN THE DIFFERENT WARDS IN PITTSBURGA FROM 1893 TO 1907 (INCL.) IS OF THE NUMBER OF BUILDINGS STANDING FEB. 1, 1893." The y-axis lists the wards from 37 to 15, with each ward represented by a black bar indicating the corresponding percentage.
The graph reveals that Ward 37 has the highest percentage, while Ward 15 has the lowest. A note at the bottom right corner clarifies that omitted wards had practically no dwellings built during the period or were not part of the city for the whole period.
Overall, this graph provides a visual representation of the distribution of dwellings built in different wards of Pittsburgh between 1893 and 1907, offering insights into the city's development during that time period.
Amazon Nova
Created by amazon.nova-lite-v1:0 on 2025-06-04
The image is a historical chart showing the percentage of total dwellings built in different wards of Pittsburgh from 1893 to 1907. The chart is titled "Percent Which the Total Dwellings Built in the Different Wards in Pittsburgh from 1893 to 1907 (Incl.) Is of the Number of Buildings Standing Feb. 1, 1893." The horizontal axis represents the wards, numbered from 1 to 38, while the vertical axis represents the percentage of total dwellings built, ranging from 0 to 270 percent. The chart uses a bar graph to illustrate the data, with each ward represented by a bar proportional to the percentage of dwellings built. A note at the bottom right corner of the chart states that omitted wards had practically no dwellings built in them during the period or were not part of the city for the whole period.
Created by amazon.nova-pro-v1:0 on 2025-06-04
The image shows a bar chart that displays the percentage of total dwellings built in the different wards in Pittsburgh from 1893 to 1907. The chart is divided into 37 bars, each representing a different ward in the city. The bars are arranged in descending order, with the highest percentage on the left and the lowest on the right. The chart also includes a note that explains that omitted wards had practically no dwellings built in them during the period or were not a part of the city for the whole period.
Google Gemini
Created by gemini-2.0-flash on 2025-05-31
Here's a description of the image:
This is a bar graph displaying data related to housing in Pittsburgh. The title states: "PERCENT WAICH THE TOTAL DWELLINGS BUILT IN THE DIFFERENT WARDS IN PITTSBURGA FROM 1893 TO 1907 (INCL.) IS OF THE NUMBER OF BUILDINGS STANDING FEB. 1, 1893."
The y-axis is labeled "WARDS" and lists different wards (37, 22, 23, 21, 19, 13, 38, 35, 20, 32, 18, 14, 31, 27, 16, 11, 36, 17, 8, 15).
The x-axis represents percentage, ranging from 0 to 270.
Each ward has a horizontal bar indicating the percentage. Ward 37 has the highest percentage, followed by ward 22. The lengths of the bars decrease as you go down the list of wards, indicating fewer dwellings built in those wards during the specified period relative to the number of buildings standing in February 1893.
A note on the right side of the graph states: "Omitted wards had practically no dwellings built in them during the period, or were not a part of the city for the whole period."
Created by gemini-2.0-flash-lite on 2025-05-31
Here's a description of the image:
Type: The image is a bar graph, designed to visually represent data.
Title and Content: The title reads: "PERCENT WAICH THE TOTAL DWELLINGS BUILT IN THE DIFFERENT WARDS IN PITTSBURGA FROM 1893 TO 1907 (INCL) IS OF THE NUMBER OF BUILDINGS STANDING FEB. 1, 1893." This indicates the graph is comparing the increase in dwellings between 1893 and 1907 within different wards of Pittsburgh to the number of buildings standing in those wards as of February 1, 1893.
Axes and Data:
- Horizontal Axis: The horizontal axis is labeled with numbers from 0 to 270, likely representing the percent increase of dwellings.
- Vertical Axis: The vertical axis lists different wards (labeled "WARDS" on the left side). Each ward number is listed with a corresponding horizontal bar.
- Data Representation: The length of each horizontal bar shows the percentage increase of dwellings in that specific ward. For example, Ward 37 has the longest bar, representing a high percentage increase.
- Note: A small text box notes, "Omitted wards had practically no dwellings built in them during the period, or were not a part of the city for the whole period."
Style and Appearance:
- The graph has a clear, simple design.
- The lines are thick, making it easy to read.
- The style is reminiscent of historical infographics.
Overall Impression: This graph provides a visual comparison of the dwelling growth in various Pittsburgh wards during the specified period.
Mistral Pixtral
Created by us.mistral.pixtral-large-2502-v1:0 on 2025-06-04
The image is a bar chart titled "Percent Which the Total Dwellings Built in the Different Wards in Pittsburgh from 1895 to 1907 (Incl.) Is of the Number of Buildings Standing Feb. 1, 1893." The chart shows the percentage of total dwellings built in various wards of Pittsburgh during the specified period.
Key points from the chart:
- Ward 37 had the highest percentage of new dwellings built, reaching approximately 260% of the number of buildings standing on February 1, 1893.
- Ward 22 also saw significant construction, with around 170% of new dwellings built.
- Ward 23 and Ward 21 had notable construction activity, with percentages around 140% and 120%, respectively.
- Ward 19 had about 110% of new dwellings built.
- Ward 13 and Ward 38 had percentages around 80% and 70%, respectively.
- Ward 35 and Ward 20 had percentages around 60% and 50%, respectively.
- Ward 32 had approximately 40% of new dwellings built.
- Ward 18 and Ward 14 had percentages around 30% and 20%, respectively.
- Ward 31 and Ward 27 had percentages around 20% and 10%, respectively.
- Ward 16, Ward 11, Ward 36, Ward 17, Ward 8, and Ward 15 had the lowest percentages, ranging from approximately 10% to less than 10%.
The chart also includes a note indicating that the wards with omitted words had practically no dwellings built in them during the period or were not part of the city for the whole period.
Qwen
Text analysis
Amazon