Machine Generated Data
Tags
Color Analysis
Feature analysis
Amazon
Clarifai
AWS Rekognition
| Rug | 74.4% | |

Categories
Imagga
created on 2022-06-04
| text visuals | 35% | |
| interior objects | 32.9% | |
| pets animals | 10.5% | |
| nature landscape | 5.3% | |
| streetview architecture | 5.2% | |
| food drinks | 3% | |
| paintings art | 2.8% | |
| cars vehicles | 2.5% | |
| events parties | 2.4% | |
Captions
Microsoft
created by unknown on 2022-06-04
| a close up of a person | 31.1% | |
| close up of a person | 25.2% | |
Clarifai
No captions written
Salesforce
Created by general-english-image-caption-blip on 2025-05-18
a photograph of a black and white photo of a graphing plot of a graphing plot of
Created by general-english-image-caption-blip-2 on 2025-07-05
an old black and white photo of a graph
OpenAI GPT
Created by gpt-4o-2024-11-20 on 2025-06-13
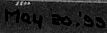
This is a historical technical graph or chart related to the Boston Elevated Railway system. It appears to show performance data for the Charlestown Division, measuring the operation of trains traveling between City Square Station and Sullivan Square Station. The chart is densely packed with information, presented on a dark grid-like background typical of engineering or transit documents from the early 20th century.
Key elements include:
Title and Labels: The top of the image identifies the connection between the two stations. Additional annotations indicate details such as time ("10.2 seconds"), velocity, and other measurements.
Graph: The main feature is a plotted curve, possibly showing acceleration or velocity over time or distance during the train's operation. There is a steep upward curve at the beginning which later flattens, indicating a rapid increase followed by stabilization.
Axes and Scale: Both axes are labeled with numbers, likely representing time, distance, velocity, or other quantities relevant to railway performance. The vertical axis seems to represent velocity or speed.
Additional Information: Along the bottom, there are notes regarding grades, slopes, and positioning of tracks for railway calculations.
Publication Information: The bottom mentions "Published by Keuffel & Esser Co., New York," indicating the document's technical origin. There is also a date noted, “May 20, 1899.”
This image reflects the detailed engineering analysis involved in early transportation systems, highlighting speed, grades, and efficiency in railway operations.
Created by gpt-4o-2024-08-06 on 2025-06-13
The image is a scan of a historical graph or chart titled "Boston Elevated Railway - Charlestown Div. - City Sq. Station to Sullivan Sq. Station." The graph appears to depict transit data from the Boston Elevated Railway. The chart illustrates speed and distance information along the railway line between City Square Station and Sullivan Square Station.
The vertical axis on the left is labeled with speed, marked in increments from 0 to 60. The horizontal axis represents distance or time, broken into segments. A plotted curve on the graph shows how the speed changes along the route, starting from zero and increasing swiftly before stabilizing, then slightly declining towards the end.
Additional annotations near the curve could indicate specific events or characteristics of the run, such as milestones, grades, or operational parameters. The document includes hand-written numbers and notes, likely detailing specific data points or metadata about the document, such as the date "May 20, 1899" and the number "3373." The lower left also notes that the graph was "Published by Kupfer & Bass, Co., New York," and it bears the designation "Standard Cross Section No. 301."
Overall, this graph likely served as an operational or analytical tool for studying or managing the Boston Elevated Railway's Charlestown Division at the turn of the 20th century.
Anthropic Claude
Created by anthropic.claude-3-haiku-20240307-v1:0 on 2025-06-17
This image appears to be a technical diagram or schematic of the Boston Elevated Railway system, specifically the Charlestown Division and City Square Station to Sullivan Square Station section. The diagram shows a grid-like layout with various measurements and labels indicating details about the railway system, such as elevation, distance, and station names. It is a detailed technical drawing or blueprint that provides information about the infrastructure and layout of this section of the Boston Elevated Railway.
Created by us.anthropic.claude-3-5-sonnet-20241022-v2:0 on 2025-06-17
This is a historical engineering diagram showing an elevation profile for the Boston Elevated Railway, specifically the Charlestown Division section between City Square Station and Sullivan Square Station. The image appears to be a technical drawing on graph paper, showing the grade changes and elevation differences along this stretch of railway. The vertical axis shows height measurements while the horizontal axis shows distance. The drawing includes a sloping line indicating the track gradient between these two stations. The document appears to be an official engineering document, with grid lines and precise measurements marked throughout. It's rendered in black and white, typical of engineering drawings from what appears to be the early 20th century.
Meta Llama
Created by us.meta.llama3-2-11b-instruct-v1:0 on 2025-06-11
The image presents a black-and-white graph on a black background, featuring a grid pattern and handwritten notes. The title at the top reads "BOSTON ELEVATED RAILWAY - CHARLESTOWN DIV - CITY SQ STATION TO SULLIVAN SQ STATION" in white text.
Key Features:
- Title: "BOSTON ELEVATED RAILWAY - CHARLESTOWN DIV - CITY SQ STATION TO SULLIVAN SQ STATION"
- Grid Pattern: A grid pattern is visible on the graph, with white lines forming squares.
- Handwritten Notes: Various handwritten notes are scattered throughout the graph, including numbers, letters, and symbols.
- Graph Lines: Several lines are drawn on the graph, including a curved line that starts at the top left and ends at the bottom right.
- Numbers and Labels: Numbers and labels are written along the x-axis and y-axis, although they are not easily legible due to the low resolution of the image.
- Background: The background of the image is black, with a slight gradient effect that gives it a dark gray tone.
Overall Impression:
The image appears to be a technical drawing or diagram related to the Boston Elevated Railway system. The graph lines and handwritten notes suggest that it may be a chart or table used for tracking or analyzing data. However, without more context or information, it is difficult to determine the exact purpose or meaning of the image.
Created by us.meta.llama3-2-90b-instruct-v1:0 on 2025-06-11
This image presents a black-and-white graph, likely a blueprint or technical drawing, featuring a grid pattern with white lines and text. The title at the top reads "BOSTON ELEVATED RAILWAY - CHARLESTOWN DIV - CITY SQ STATION TO SULLIVAN SQ STATION." The graph appears to be a cross-section of a railway, with various measurements and labels indicating different aspects of the railway's design.
The graph is divided into sections, each representing a different part of the railway. The left side of the graph shows a series of vertical lines, which may represent the elevation of the railway at different points. The right side of the graph shows a series of horizontal lines, which may represent the distance along the railway.
In the center of the graph, there is a large curved line that represents the path of the railway. This line is labeled with various measurements and notes, which provide additional information about the railway's design.
Overall, this graph appears to be a detailed technical drawing of a railway, providing information about its elevation, distance, and other design features. It is likely that this graph was used by engineers or architects to plan and design the railway, and it may have been used as a reference during construction.
Amazon Nova
Created by amazon.nova-lite-v1:0 on 2025-06-09
The image depicts a technical document or diagram related to the Boston Elevated Railway, specifically focusing on the Charlestown Division. The document appears to be a technical report or a data sheet, as it contains a table with various measurements and calculations. The table includes columns for distances, times, and speeds, suggesting it is used to analyze the performance of the railway system.
The document is dated May 20, 1958, and includes a reference to "Standard Cross Section" and "Cross Section." The document also mentions "City Square Station to Sullivan Square Station," indicating it is focused on a specific segment of the railway line.
The table includes a variety of measurements, such as distances in feet, times in seconds, and speeds in miles per hour. The document also includes calculations for average speeds and other performance metrics.
Overall, the image appears to be a technical document used to analyze the performance of a specific segment of the Boston Elevated Railway system. The document includes a variety of measurements and calculations, and is dated May 20, 1958.
Created by amazon.nova-pro-v1:0 on 2025-06-09
The image depicts a graph titled "Boston Elevated Railway - Charlestown Div. - City Sq. Station to Sullivan Sq. Station." The graph is divided into two main sections: the top section and the bottom section.
The top section of the graph features a time-distance chart, with the x-axis representing time in seconds and the y-axis representing distance in feet. The chart shows a curve that represents the travel time and distance between the City Square Station and the Sullivan Square Station. The curve is divided into segments, each representing a specific time interval. The chart also includes annotations indicating the average speed in feet per second.
The bottom section of the graph contains additional information, including the date of the graph (May 20, 1933) and the number "3373." There are also annotations and labels indicating various points along the curve, such as "R-Sullivan Sq." and "R-City Sq."
Overall, the graph provides a detailed representation of the travel time and distance between the City Square Station and the Sullivan Square Station on the Boston Elevated Railway, with additional information and annotations to aid in interpretation.
Google Gemini
Created by gemini-2.0-flash on 2025-06-03
Here's a description of the image:
The image is a black and white technical graph or chart, titled "BOSTON ELEVATED RAILWAY - CHARLESTOWN DIV - CITY SQ. STATION TO SULLIVAN SQ. STATION." It appears to be an engineering document related to the Boston Elevated Railway system.
Key elements of the image include:
Grid: The background is a grid pattern, typical of graphs or charts used for plotting data.
Title and Information: At the top, the title clearly identifies the railway division and the specific stations involved. Additional information like "Distance between Stations 6010 ft," "Time 150.9 Seconds," and "Average Speed 21.5 miles per hour" is also present.
Data Lines: A prominent curved line dominates the graph, likely representing the speed or performance of the railway cars. There are also other lines toward the bottom of the graph, possibly depicting alignment, grades, or other technical data related to the railway's track and path.
Labels and Axis Titles: The left side of the graph appears to have labels like "City Square Station" and values, possibly representing speed in miles per hour and distance in feet per second. Other labels include "Friction on Curves," "Alignment," and "Grades."
Date and Publication Information: The bottom of the image includes a date: "May 20.53" and details like "PUBLISHED BY KEUFFEL & ESSER CO., NEW YORK," suggesting this was printed by a known publisher of engineering and drafting supplies. The note “Standard Cross Section” is also visible.
Numbers: The number "3373" is visible in the bottom right corner of the chart.
Created by gemini-2.0-flash-lite on 2025-06-03
This is a technical drawing or graph, likely a historical document related to the Boston Elevated Railway. Here's a breakdown of the visible elements:
Title and Context:
- Title: "BOSTON ELEVATED RAILWAY - CHARLESTOWN DIV. - CITY SQ. STATION TO SULLIVAN SO. STATION". This tells us the graph is about a railway section, specifically the route between City Square Station and Sullivan Square Station in the Charlestown division.
- Additional Data: "Distance between Stations 6010 A" implies that the graph contains distance data. It also mentions "Time 190.9 Seconds" which is the total time taken from City Sq. to Sullivan Sq. and "Average Speed smiles per hr", which implies that the graph contains speed data.
- Date: "May 20.53" suggests this was created in May of 1953.
Graph Components:
- Axes: There are two main axes:
- Vertical Axis: Labeled as "City Square Station". It likely represents the distance from City Square station.
- Horizontal Axis: The horizontal axis likely indicates the horizontal distance along the track.
- Lines and Curves: The graph displays a primary curved line that rises quickly and then flattens out. The curve likely represents the train's speed over distance between the two stations.
- Labels: There are annotations along the bottom of the graph, likely with information about the railway track, like the location of curves, grades, and levels,
- "Standard Cross Section" and Other Markings: The presence of "Standard Cross Section" suggests that this graph might show the construction details of a cross-section of the rail tracks.
- "Published by KEUFFEL & ESSER CO., NEW YORK": This indicates the graph was likely created or produced by a company that made engineering and drafting equipment.
Overall Impression:
The image represents a technical engineering document. It's a chart showing the performance of a train on a specific section of the Boston Elevated Railway. It likely provides details on speed and other relevant factors for railway operations. The presence of the company name, date and other technical terms confirms the fact.
Mistral Pixtral
Created by us.mistral.pixtral-large-2502-v1:0 on 2025-06-06
The image is a detailed technical drawing or blueprint of a section of the Boston Elevated Railway, specifically the Charlestown Division, from City Square Station to Sullivan Square Station. The drawing appears to be a profile view, showing the elevation and gradient of the railway track along this route.
Key features of the drawing include:
Title and Information:
- The title at the top indicates the railway line and the stations it connects: "Boston Elevated Railway - Charlestown Div - City Sq. Station to Sullivan Sq. Station."
- Additional information includes the date of the drawing (May 20, 1913) and a reference number (3373).
Elevation Profile:
- The vertical axis represents elevation, marked in feet above sea level.
- The horizontal axis represents the distance along the track, marked in feet.
- The profile shows the changes in elevation along the route, with a notable incline starting from City Square Station and leveling off as it approaches Sullivan Square Station.
Gradient Information:
- The drawing includes specific gradient percentages at various points along the route, indicating the steepness of the track.
- For example, there is a gradient of +2.2% at one point, indicating a rise in elevation.
Station Locations:
- The locations of City Square Station and Sullivan Square Station are marked on the drawing.
- City Square Station is at the lower left, and Sullivan Square Station is at the upper right.
Additional Details:
- The drawing includes various annotations and measurements, such as distances between points and specific elevation marks.
- There is a note about the average grade and the maximum grade of the track.
Publisher Information:
- The drawing was published by Keuffel & Esser Co., New York.
Overall, this blueprint provides a detailed technical representation of the railway's elevation and gradient between two specific stations, useful for engineering and operational purposes.
Qwen
Created by Qwen/Qwen2.5-VL-7B-Instruct on 2025-07-11
The image is a technical drawing or blueprint of a section of the Boston Elevated Railway, specifically the Charlestown Division line between City Square Station and Sullivan Square Station. The content includes a detailed profile of the railway line, showing its elevation changes along the route. The drawing is on graph paper, with a scale and measurements along the side and bottom axes. The graph shows a steep incline at the beginning, indicating a significant rise in elevation, followed by a gradual leveling off towards the end. The title at the top provides the specific route and the stations involved. The bottom of the drawing includes additional technical details such as alignment, grades, and other specifications relevant to the construction of the railway line. The date "May 20, '95" and the number "3373" are visible, likely indicating the date of the drawing or its revision and a reference number for the blueprint.
Created by Qwen/Qwen2.5-VL-72B-Instruct on 2025-07-11
This image shows a vintage engineering diagram or chart related to the Boston Elevated Railway, specifically the Charlestown Division between City Square Station and Sullivan Square Station. The diagram appears to be a velocity-time graph, as indicated by the labels on the axes and the annotations.
- The horizontal axis represents time, marked in seconds, ranging from 0 to approximately 120 seconds.
- The vertical axis represents distance, marked in feet, ranging from 0 to about 60 feet.
- The graph line starts at the origin (0,0) and follows a steeply inclined curve, indicating an increase in speed over time, which then levels off to a nearly flat line, suggesting a constant speed is reached.
There are various labels and annotations on the chart, including:
- "Distance between stations 600ft."
- "Time 112.0 seconds."
- "Average speed 21 miles per hour."
- "Friction on curves."
- "Grade."
The chart is dated May 20, 1905, and has the number 3373 in the bottom right corner. The chart is marked as "Published by Keuffel & Esser Co., New York," and it includes a "Standard Cross Section" label. The overall appearance suggests it is an older document, likely used for planning and analysis of the railway line's performance.
Text analysis
Amazon