Machine Generated Data
Tags
Color Analysis
Feature analysis
Amazon
Clarifai

Clarifai
| Vehicle | 44.4% | |


Categories
Imagga
created on 2022-06-04
| streetview architecture | 58.9% | |
| paintings art | 34% | |
| text visuals | 3% | |
| nature landscape | 2% | |
| events parties | 1.6% | |
Captions
Microsoft
created by unknown on 2022-06-04
| a screen shot of a computer | 46.1% | |
| a close up of a screen | 46% | |
| a screen shot of a computer screen | 37.3% | |
Clarifai
No captions written
Salesforce
Created by general-english-image-caption-blip on 2025-05-18
a photograph of a graph - based image of a graph - based graph - based data visual data
Created by general-english-image-caption-blip-2 on 2025-07-07
a black and white photo of a graph
OpenAI GPT
Created by gpt-4o-2024-11-20 on 2025-06-13
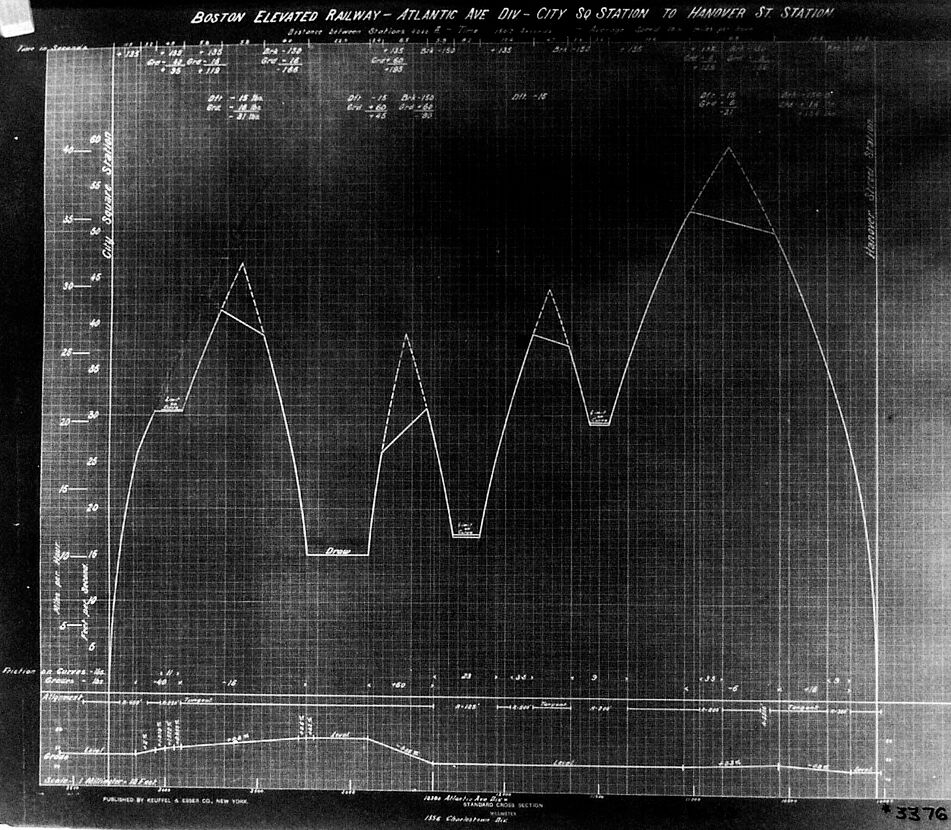
This is an engineering chart or graph depicting elevation and grade information for the Boston Elevated Railway. It shows the elevation profile from City Square Station to Hanover Street Station along the Atlantic Avenue Division. The grid lines in the background help visualize the changes in elevation, likely measured in feet. The uneven peaks and valleys on the chart represent changes in grade or slope along the railway.
The text annotations provide details such as distances, elevation measurements, station locations, and other technical specifications. The bottom section of the chart appears to provide a cross-section of the railway or related information on track grading, slopes, or infrastructure near the railway.
This document is likely from an earlier era when technical plans for transit systems were drawn manually on graph paper, and scales were carefully marked. It is useful for visualizing elevation changes for railway construction or operations planning.
Created by gpt-4o-2024-08-06 on 2025-06-13
The image is a black and white technical diagram depicting a grade profile for a section of the Boston Elevated Railway, specifically the Atlantic Avenue Division from City Square Station to Hanover Street Station.
The diagram features a grid background, with vertical and horizontal lines indicating measurements. On the vertical axis, labeled on the left, there are elevation values in feet, while the horizontal axis represents distance or station locations along the railway line.
The graph includes a line that fluctuates, indicating changes in elevation along the specified section of the railway. Several peaks and troughs are evident, showing the inclines and declines the railway encounters. Numerical values and labels along the line provide additional information about the elevation changes at specific points.
At the bottom of the diagram, below the main graph, there is another line representing the track's vertical alignment in a more simplified form, with additional measurements and labels. The top of the image has a title indicating the railway line and the section of interest. The image also bears a publication mark from the Keuffel & Esser Co., a company known for producing drafting instruments and tools.
Anthropic Claude
Created by anthropic.claude-3-haiku-20240307-v1:0 on 2025-06-17
The image appears to be a graph or chart showing the Boston Elevated Railway - Atlantic Ave. Div. - City Sq. Station to Hanover St. Station. The graph displays a series of peaks and valleys, likely representing the elevation or terrain along the railway route. There are no human faces or identities visible in this image.
Created by us.anthropic.claude-3-5-sonnet-20241022-v2:0 on 2025-06-17
This image shows an elevation profile or track gradient diagram for the Boston Elevated Railway, specifically the Atlantic Ave Division between City Sq Station and Hanover St Station. The diagram appears to be a technical drawing on graph paper, showing the changes in elevation along the railway route. The profile features several peaks and valleys, creating a mountain-like silhouette against the gridded background. The vertical axis appears to show elevation measurements, while the horizontal axis likely represents distance along the route. The drawing is in black and white, typical of historical engineering documents, and includes various numerical annotations and measurements along both axes. The overall pattern shows significant elevation changes along this section of the railway line, which would have been important information for railway engineers and operators.
Meta Llama
Created by us.meta.llama3-2-11b-instruct-v1:0 on 2025-06-11
The image is a black-and-white blueprint of a graph, titled "Boston Elevated Railway - Atlantic Ave Div - to City Sq Station Hanover St Station." The graph features a grid pattern with white lines and text on a black background. The title is written in white at the top of the page.
Key Features:
- Title: "Boston Elevated Railway - Atlantic Ave Div - to City Sq Station Hanover St Station"
- Graph: A grid pattern with white lines and text on a black background
- Scale: The graph has a scale on the left side, with numbers ranging from 0 to 50
- Data Points: There are several data points plotted on the graph, including a line that starts at around 20 and increases to around 40
- Labels: The graph has labels on the x-axis and y-axis, but they are not legible
- Numbers: There are several numbers scattered throughout the graph, including 3376 in the bottom-right corner
Overall:
The image appears to be a technical drawing or blueprint of some kind, possibly related to the construction or maintenance of a railway system. The graph suggests that there may be some kind of data or measurement being tracked, but the specific meaning of the graph is unclear without more context.
Created by us.meta.llama3-2-90b-instruct-v1:0 on 2025-06-11
The image presents a black-and-white graph titled "Boston Elevated Railway - Atlantic Ave Div - City So Station to Hanover St Station." The graph features a grid pattern with white lines and text, set against a black background. The title is written in white at the top of the image.
The graph appears to be a technical drawing or blueprint, likely used for planning or construction purposes. It includes various symbols, markings, and annotations that provide additional information about the railway system. The graph also features a scale on the left side, which allows users to measure distances and proportions.
Overall, the image provides a detailed and technical representation of the Boston Elevated Railway system, highlighting its layout, infrastructure, and key features.
Amazon Nova
Created by amazon.nova-lite-v1:0 on 2025-06-09
The image shows a map of the Boston Elevated Railway, specifically the Atlantic Avenue Line, which runs from City Square Station to Hanover Street Station. The map is divided into two sections, with the upper section showing the distance between stations in feet and the lower section showing the elevation of the railway in feet. The map is labeled with the names of the stations, as well as the distances between them. The map is a black-and-white image, with the text and numbers printed in white font on a black background.
Created by amazon.nova-pro-v1:0 on 2025-06-09
The image is a detailed graph of the Boston Elevated Railway's Atlantic Avenue Line, specifically from City Square Station to Hanover Street Station. The graph is presented in black and white, with a grid overlay to help with the visualization of data points and measurements.
The graph is divided into two main sections: the top section shows the elevation profile of the railway line, while the bottom section displays the distance along the line.
The elevation profile is represented by a line graph that starts at the left side of the graph and moves towards the right. The elevation changes are marked with various peaks and troughs, indicating the ups and downs of the railway line. The elevation is measured in feet, with the vertical axis on the left side of the graph.
The distance along the line is represented by a horizontal axis at the bottom of the graph. The distance is measured in feet, and the scale is marked at regular intervals. The distance starts at the left side of the graph and increases as you move towards the right.
The graph also includes various annotations and labels to provide additional information about the railway line. These annotations include the names of the stations, the distances between them, and other relevant details.
Overall, the graph provides a detailed and precise representation of the Boston Elevated Railway's Atlantic Avenue Line, allowing for a clear understanding of the elevation changes and distances along the line.
Google Gemini
Created by gemini-2.0-flash on 2025-06-03
Here's a description of the image:
The image appears to be a technical blueprint or diagram, likely from the early 20th century. It depicts a graphical representation of the elevation changes along a section of the Boston Elevated Railway, specifically the Atlantic Avenue Division, running from City Square Station to Hanover Street Station.
The graph is overlaid on a grid, with the vertical axis labeled "City Square Station" representing elevation and the horizontal axis indicating distance. A series of peaks and valleys are plotted, visually indicating the ups and downs of the railway track. Annotations and numerical data are present, likely detailing the gradients, distances between stations, and perhaps timings. The graph is annotated with the text "Drew".
Below the primary graph, additional information is presented in a more schematic format, including alignment details and gross levels. Text indicates the scale of the drawing.
The image is in black and white and looks like a vintage engineering drawing, showing some signs of aging. The document is labeled as being published by "Keuffel & Esser Co., New York," a known manufacturer of drafting and surveying instruments. A reference number "*3376" appears in the bottom right corner.
Created by gemini-2.0-flash-lite on 2025-06-03
Here is a description of the image:
The image appears to be a technical drawing or blueprint, likely related to the design or engineering of a railway line. The title at the top indicates the subject: "Boston Elevated Railway - Atlantic Ave Div - City Sq Station to Hanover St Station".
Here's a breakdown of the elements:
- Graph: The central part of the image is a graph. The graph's axes are difficult to decipher, but it appears to display the elevation profile of the railway line. The line shows the rise and fall of the tracks.
- Elevation Profile: The prominent, jagged line likely represents the track's vertical profile. It shows climbs and descents, indicating the route's hills and valleys.
- Labels and Annotations: There are several annotations and labels. These likely provide key information:
- Station names (City Sq Station and Hanover St Station)
- Possibly measurements for elevation, distance, or grades (slopes)
- Text annotations like "Drew" might indicate specific points or features along the track.
- Scale: It seems there is a scale to measure the track.
Overall, it's a detailed technical diagram used for railway construction or design.
Mistral Pixtral
Created by us.mistral.pixtral-large-2502-v1:0 on 2025-06-05
The image is a detailed engineering drawing of a section of the Boston Elevated Railway, specifically from the Atlantic Avenue Division, City Square Station to Hanover Street Station. This type of drawing is often used in railway engineering to depict the vertical profile of the railway tracks along a given route.
Key features of the drawing include:
Vertical Profile: The main part of the drawing shows the vertical profile of the railway tracks. The vertical axis represents elevation, while the horizontal axis represents distance along the route. The profile line shows the changes in elevation, including rises and falls in the track level.
Stations and Landmarks: The drawing includes labels for various stations and landmarks along the route. Notable points include City Square Station and Hanover Street Station.
Gradients: The drawing indicates the gradients (slopes) of the track at various points. These are typically shown as ratios (e.g., 1:100), indicating the rise or fall per unit of horizontal distance.
Curves and Distances: The drawing includes information about the curvature of the tracks and the distances between points. This is crucial for understanding the layout and design of the railway.
Annotations: Various annotations and measurements are included, providing detailed information about the track's geometry, elevations, and other relevant data.
Scale and Units: The drawing likely includes a scale and units of measurement, which are essential for interpreting the distances and elevations accurately.
Overall, this drawing is a technical document used by engineers and railway planners to understand and manage the vertical alignment of the railway tracks between the specified stations.
Qwen
Created by Qwen/Qwen2.5-VL-7B-Instruct on 2025-07-05
This is a technical blueprint or map detailing the geometry and alignment of an elevated railway section in Boston, specifically the "Atlantic Ave Div - City Sq Station to Hanover St Station" of the Boston Elevated Railway. The document includes a detailed profile of the railway's track, showing gradients, curves, and changes in elevation.
Key elements of the blueprint include:
- A vertical axis labeled "Elevation" at the left side, indicating the height of the railway above ground level.
- A horizontal axis at the bottom representing the distance or alignment along the railway.
- Multiple segments of the railway track are depicted with varying heights, indicating the track's elevation changes as it passes through different geographical features.
- Annotations and measurements are provided for each segment, including distances between points, elevation changes, and curve radii.
- The document is published by Keesell & Esser Co., New York, which suggests it was likely used for engineering or construction purposes.
The profile shows that the railway track includes several elevated sections, dips, and curves, designed to navigate the topography of the area between City Square Station and Hanover Street Station.
Created by Qwen/Qwen2.5-VL-72B-Instruct on 2025-07-05
This image is a technical diagram of the Boston Elevated Railway, specifically the Atlantic Avenue Division, from City Square Station to Hanover Street Station. The diagram appears to be a time-distance graph, showing the distance between stations and the time it takes to travel between them. The graph has a grid background with numerical values along the axes. There are several lines on the graph, each representing different train routes or schedules. The lines are labeled with station names such as "City Square Station," "Hanover Street Station," and "O'neil." The diagram also includes additional information such as train speeds, distances, and other relevant data. The overall layout and design suggest that this is a technical document used for railway operations and planning.
Text analysis
Amazon