Machine Generated Data
Tags
Color Analysis
Feature analysis
Amazon
Clarifai

Clarifai
| Poster | 86.8% | |
Categories
Imagga
created on 2022-06-04
| text visuals | 59% | |
| paintings art | 40.9% | |
Captions
Microsoft
created by unknown on 2022-06-04
| diagram | 100% | |
Clarifai
No captions written
Salesforce
Created by general-english-image-caption-blip on 2025-05-02
a photograph of a poster for a labor labor day event
Created by general-english-image-caption-blip-2 on 2025-07-06
a black and white photo of a circular with the words operating expenses
OpenAI GPT
Created by gpt-4o-2024-11-20 on 2025-06-09
This image is a historical financial infographic from 1910, illustrating the distribution of gross earnings for a specific railway company for the year ending September 30, 1910. It uses a circular chart to break down the operating expenses and income allocation, with various slices showing portions dedicated to labor, material, taxes, dividends, rentals, interest, and surplus.
Key elements of the image:
Circular Breakdown:
- The chart highlights operating expenses, which include labor ($6,061,194.96) and material & other items ($3,903,070.36).
- Smaller portions are allocated to taxes ($1,143,553.36), coupon interest ($1,243,492.50), rentals of leased railways ($1,353,193.70), and dividends on capital stock ($1,197,000).
Design of the Central 5¢ Symbol:
- The number "5¢" is featured prominently in the center, symbolizing the cost associated with these expenditures per unit or ticket, potentially representing the per-passenger revenue.
Additional Details:
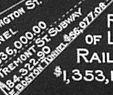
- A detailed ledger breakdown is included at the bottom of the image, listing further subcategories such as "Rentals of Subway & Tunnels," specifying costs for East Boston Tunnel ($56,077.08), Tremont St. Subway ($184,322.90), and Washington St. Tunnel ($336,000.00).
Total Amount:
- All these costs are tallied, showing a grand total of $15,503,410.92.
This infographic represents a detailed visualization of financial distribution and provides insight into how earnings were allocated in the rail industry during this period.
Created by gpt-4o-2024-08-06 on 2025-06-09
The image is a financial infographic illustrating the distribution of gross earnings for the year ending September 30, 1910. It uses a circular chart to show how much of each dollar (depicted as 5 cents in this case) is allocated to various expenses.
The central part of the image emphasizes "Operating Expenses," which are divided into various categories. The sections include:
- Labor: $6,061,194.96
- Material and all other items: $3,903,070.36
- Taxes: $1,143,553.36
- Coupon Interest: $1,243,492.50
- Rentals of Leased Railways: $1,353,193.70
- Dividends on Capital Stock: $1,197,000.00
- Surplus: $25,506.06
It also details specific expenses for rentals of subway and tunnels, such as:
- East Boston Tunnel: $56,077.08
- Tremont St. Subway: $184,322.90
- Washington St. Tunnel: $336,000.00
The total sum, "$15,503,410.92", accounts for all the expenses listed.
Overall, the diagram visually represents how each expense category contributes to the total earnings distribution in the form of a segmented pie chart. Each section's size corresponds to the monetary value allocated to that particular spending category.
Anthropic Claude
Created by anthropic.claude-3-haiku-20240307-v1:0 on 2025-06-17
The image appears to be a distribution of gross earnings for the year ending September 30, 1910. It shows the breakdown of various expenses and revenue sources, including labor, material and all other items, operating expenses, taxes, interest, and dividends on capital stock. The pie chart in the center displays the percentages of these different categories, with "Operating Expenses" taking up the largest slice at 50%.
Created by us.anthropic.claude-3-5-sonnet-20241022-v2:0 on 2025-06-17
This image shows a pie chart and financial statement detailing the "Distribution of Gross Earnings" for the year ending September 30, 1910. The pie chart is divided into several sections showing operating expenses, with a large "5" in the center.
The major expense categories include:
- Labor: $6,061,194.96
- Material and all other items: $3,903,070.36
- Taxes: $1,143,553.36
- Coupon Interest: $1,243,492.50
- Rentals of Leased Railways: $1,353,193.70
- Various subway and tunnel rentals
- Dividends on Capital Stock: $1,197,000.00
- Surplus: $25,506.06
Below the pie chart is a detailed breakdown of these expenses in a tabular format, with the total amount being $15,503,410.92.
The presentation is in black and white, with hatching used to distinguish different sections of the pie chart. It appears to be a historical financial document, likely from a railway or transit company given the references to subway and tunnel rentals.
Meta Llama
Created by us.meta.llama3-2-11b-instruct-v1:0 on 2025-05-28
The image depicts a black-and-white document titled "Distribution of Gross Earnings for the year ending September 30, 1910," featuring a circular diagram with a central "5c" and various labels and numbers. The diagram is divided into sections, each representing a different category of expenses, including Labor, Dividends on Capital Stock, Surplus, Material and All Other Items, Coupon Interest, Taxes, Rentals of Leased Railways, and Operating Expenses. The document also includes a list of operating expenses, taxes, and surpluses, along with the total amount of gross earnings for the year.
The document appears to be a financial report or statement, likely from a company or organization that operates railroads or other transportation services. The use of a circular diagram and the inclusion of various categories of expenses suggest that the document is intended to provide a clear and concise overview of the company's financial performance for the year.
Overall, the image provides a detailed and informative snapshot of the company's financial situation at the end of 1910, highlighting the various expenses and revenues that contributed to its overall gross earnings.
Created by us.meta.llama3-2-90b-instruct-v1:0 on 2025-05-28
The image presents a circular chart illustrating the distribution of gross earnings for the year ending September 30, 1910. The chart is divided into sections, each representing a distinct category of expenses.
Operating Expenses
- Labor: $6,061,194.96
- Materials and All Other Items: $3,903,070.36
- Rentals of Leased Railways: $1,353,193.70
- Coupon Interest: $1,243,492.50
- Taxes: $1,143,553.36
- Dividends on Capital Stock: $1,197,000.00
- Surplus: $25,506.06
Total Operating Expenses: $15,503,410.92
The chart provides a clear visual representation of the various expenses incurred by the company during the specified period, allowing for easy comparison and analysis of the different categories.
Amazon Nova
Created by amazon.nova-lite-v1:0 on 2025-06-04
The image is a financial report titled "Distribution of Gross Earnings for the year ending September 30, 1910." It contains a pie chart and a table showing the breakdown of operating expenses and gross earnings.
The pie chart illustrates the distribution of gross earnings, with the largest portion attributed to "Labor" at $6,061,194.96, followed by "Material and All Other Items" at $3,903,070.36. Other categories include "Dividends on Capital Stock," "Rentals of Leased Railways," "Coupon Interest," "Taxes," and "Surplus."
The table provides a detailed breakdown of operating expenses, including labor, material, taxes, coupon interest, rentals of leased railways, rentals of subway and tunnels, fast Boston Tunnel, Tremont St. Subway, Washington St. Tunnel, dividends paid on capital stock, and surplus. The total operating expenses amount to $9,964,265.32.
The gross earnings for the year are $15,503,410.92, which includes the total operating expenses and the surplus.
Created by amazon.nova-pro-v1:0 on 2025-06-04
The image is a financial document titled "Distribution of Gross Earnings for the year ending September 30, 1910." The document is presented in a circular format with various sectors representing different categories of expenses and earnings. Here is a detailed description of the document:
Document Title and Date
- Title: Distribution of Gross Earnings
- Year Ending: September 30, 1910
Circular Breakdown
The circular chart is divided into multiple segments, each representing a different category of expenses or earnings. The categories are:
Operating Expenses:
- Labor: $6,061,194.96
- Material: $3,903,070.36
Taxes: $1,143,553.36
Coupon Interest: $1,243,492.50
Rentals:
- Leased Railways: $1,353,193.70
- Subway and Tunnels: $576,399.98
Dividends on Capital Stock: $1,197,000.00
Surplus: $25,506.06
Total Gross Earnings
- Total Gross Earnings: $15,503,410.92
Detailed Breakdown of Rentals
The rentals are further broken down into specific categories:
- Fast Boston Tunnel: $56,077.08
- Tremont St. Subway: $184,322.90
- Washington St. Tunnel: $336,000.00
Analysis and Description
The document provides a comprehensive overview of the financial distribution for the year ending September 30, 1910. The circular format allows for a visual representation of the different categories and their respective amounts. The largest segment is "Operating Expenses," which includes both labor and material costs, totaling $9,964,265.32. This indicates that a significant portion of the gross earnings was allocated towards operational costs.
Taxes and coupon interest are also substantial, with taxes amounting to $1,143,553.36 and coupon interest to $1,243,492.50. Rentals, including leased railways and subway and tunnels, total $1,929,593.68, highlighting the importance of these expenses in the overall financial picture.
Dividends paid on capital stock are $1,197,000.00, and there is a small surplus of $25,506.06, indicating that after all expenses and dividends, there is a minor positive balance.
Conclusion
This financial document offers a clear and detailed breakdown of the gross earnings distribution for the specified year. The use of a circular chart effectively conveys the relative sizes of each category, making it easy to understand the financial priorities and allocations of the organization during that period.
Google Gemini
Created by gemini-2.0-flash-lite on 2025-05-23
The image is a black and white vintage infographic, specifically a pie chart, titled "Distribution of Gross Earnings for the year ending September 30, 1910." The chart is a classic circular design, divided into sections representing different categories of operating expenses. The dominant element is a large "5¢" in the center, representing the overall earnings, which are then broken down into component costs.
The chart's segments include:
- Labor: $6,061,194.96
- Material and all other items: $3,903,070.36
- Taxes: $1,143,553.36
- Coupon Interest: $1,243,492.50
- Rentals of Leased Railways: $1,353,193.70
- Dividends on Capital Stock: $1,197,000.00
- Rentals of Subway and Tunnels: Breakdown of these tunnel costs are given as follows:
- East Boston Tunnel: $56,077.08
- Tremont St. Subway: $184,322.90
- Washington St. Tunnel: $336,000.00
- Surplus: $25,506.06
There is a list below the chart that appears to be a summary of the information and the totals for the different categories. The total for Operating Expenses is noted as $9,964,265.32 and the Total is $15,503,410.92. The chart is rendered in a minimalist style, reflecting the era in which it was created.
Created by gemini-2.0-flash on 2025-05-23
Here's a description of the image:
The image is a circular pie chart titled "Distribution of Gross Earnings for the year ending September 30, 1910," representing "Operating Expenses." The chart is divided into sections with different expenses labeled: "Labor" ($6,061,194.96), "Dividends on Capital Stock" ($1,197,000.00), "Rentals of Leased Railways" ($1,353,193.70), "Coupon Interest" ($1,243,492.50), "Taxes" ($1,143,553.36), "Material and All Other Items" ($3,903,070.36), and "Surplus" ($25,506.06). Within "Rentals of Subway and Tunnels," it is further broken down into "East Boston Tunnel" ($56,077.08), "Tremont St. Subway" ($184,322.90), and "Washington St. Tunnel" ($336,000.00). The chart is formatted as a circle on a black background, with white text and lines.
Below the chart, there is a list of the expenses with corresponding dollar amounts that coincide with the chart's elements. The total amount is stated as $15,503,410.92.
Mistral Pixtral
Created by us.mistral.pixtral-large-2502-v1:0 on 2025-06-06
The image is a detailed financial diagram titled "Distribution of Gross Earnings for the year ending September 30, 1910." It visually represents the allocation of gross earnings into various operating expenses for a company or organization.
Key elements of the diagram include:
Central Circle:
- The central circle is divided into segments, each representing a different category of operating expenses.
- The segments are labeled with their respective costs.
Expense Categories:
- Labor: $6,061,194.96
- Material and All Other Items: $3,903,070.36
- Taxes: $1,143,553.36
- Coupon Interest: $1,243,492.50
- Rentals of Leased Railways: $1,353,193.70
- Rentals of Subways and Tunnels: $576,599.98
- Washington St. Tunnel: $336,000.00
- East Boston Tunnel: $184,061.90
- Tremont St. Subway: $66,537.08
- Dividends on Capital Stock: $1,197,000.00
- Surplus: $25,506.06
Total Operating Expenses:
- The total operating expenses amount to $9,964,265.32.
Total Gross Earnings:
- The total gross earnings for the year are $15,503,410.92.
Visual Representation:
- The diagram uses a pie chart format to illustrate the proportion of each expense category relative to the total operating expenses.
- The large number "5" in the center likely represents the 5 cents out of every dollar of gross earnings that is allocated to operating expenses.
This diagram provides a clear and concise visualization of how the gross earnings were distributed among various expense categories for the fiscal year ending September 30, 1910.
Qwen
Created by Qwen/Qwen2.5-VL-7B-Instruct on 2025-07-11
The image is a circular diagram illustrating the distribution of gross earnings for the year ending September 30, 1910. The diagram is divided into sections, each representing a different expense category, with the total earnings being $15,503,410.92. The central part of the circle prominently features the text "OPERATING EXPENSES" and a large "5¢" symbol, indicating that labor costs constitute 5% of the total expenses. Below the central circle, there is a breakdown of the expenses into various categories, such as labor, material, rentals, taxes, and dividends.
Here are the detailed figures for each category:
- Labor: $6,061,194.96
- Material and all other items: $3,903,070.36
- Taxes: $1,143,553.36
- Coupon interest: $1,243,492.50
- Rentals of leased railways: $1,353,193.70
- Rentals of subway & tunnels: $576,399.98
- Washington St. Tunnel: $336,000.00
- Tremont St. Subway: $184,322.90
- East Boston Tunnel: $56,077.08
- Dividends on capital stock: $1,197,000.00
- Surplus: $25,506.06
The bottom part of the image provides a tabular breakdown of the expenses, totaling $9,964,265.32, and the dividends paid on capital stock, totaling $1,197,000.00.
Created by Qwen/Qwen2.5-VL-72B-Instruct on 2025-07-11
This is a black-and-white image of a financial infographic from 1910, depicting the distribution of gross earnings for a transportation company. The title at the top reads, "Distribution of Gross Earnings for the year ending September 30, 1910."
The infographic uses a circular design resembling a penny, with the number "5" and the cent symbol "¢" prominently displayed in the center. The circle is divided into several segments, each representing different categories of operating expenses:
- Labor: $6,061,194.96
- Material and all other items: $3,903,070.36
- Taxes: $1,143,553.36
- Coupon Interest: $1,243,492.50
- Rentals of Leased Railways: $1,353,193.70
- Rentals of Subway & Tunnels: $576,399.98 (broken down further into East Boston Tunnel, Tremont St. Subway, and Washington St. Tunnel)
- Dividends on Capital Stock: $1,197,000.00
- Surplus: $25,506.06
Below the circular diagram, there is a table summarizing the total expenses:
- Operating Expenses (Labor + Material): $9,964,265.32
- Taxes: $1,143,553.36
- Coupon Interest: $1,243,492.50
- Rentals of Leased Railways: $1,353,193.70
- Rentals of Subway & Tunnels: $576,399.98
- Dividends paid on Capital Stock: $1,197,000.00
- Surplus: $25,506.06
- Total: $15,503,410.92
The infographic is designed to visually represent the proportions of each expense category in relation to the total operating expenses.
Text analysis
Amazon