Machine Generated Data
Tags
Color Analysis
Categories
Imagga
created on 2022-06-04
| text visuals | 99% | |
Captions
Microsoft
created by unknown on 2022-06-04
| a screen shot of a cage | 89% | |
| a close up of a cage | 87.3% | |
| a screen shot of a person in a cage | 73.1% | |
Clarifai
Created by general-english-image-caption-clip on 2025-07-12
a diagram showing the rate of change.
Salesforce
Created by general-english-image-caption-blip on 2025-05-28
a photograph of a graph - based graph - based graph - based data visual data visual data visual
Created by general-english-image-caption-blip-2 on 2025-07-06
a black and white photo of a graph showing the price of oil
OpenAI GPT
Created by gpt-4o-2024-11-20 on 2025-06-12
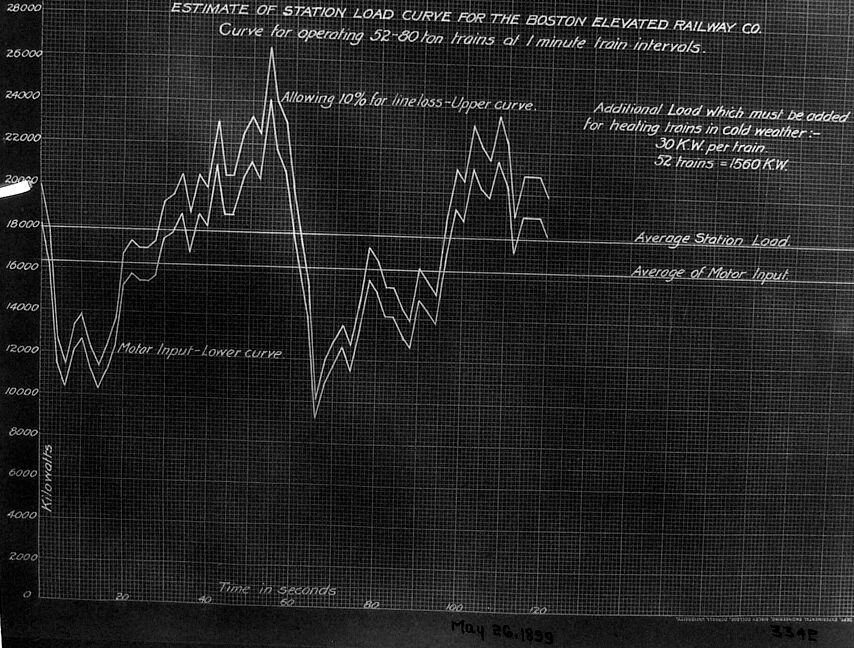
This image is an engineering graph, estimated for the Boston Elevated Railway Company, dated May 26, 1899. It depicts station load curves associated with operating 52-60 ton trains at one-minute intervals. The horizontal axis represents time in seconds, while the vertical axis measures power consumption in kilowatts.
There are two main fluctuating curves plotted within the grid. One is labeled as the "Motor Input" (lower curve), and the other is labeled as the upper curve, which indicates power values including a 10% allowance for line loss. Horizontal lines provide reference values for the "Average Station Load" and the "Average of Motor Input." An annotation mentions an additional load for heating trains in cold weather, calculated as 30 kW per train, for a total of 1560 kW for 52 trains.
The graph, characterized by dramatic spikes and dips in both curves, likely represents variations in power demands during operation. The handwritten annotations and vintage charting style give it a distinct historical appearance.
Created by gpt-4o-2024-08-06 on 2025-06-12
The image shows an old graphical chart titled "Estimate of Station Load Curve for the Boston Elevated Railway Co." The chart displays two curves depicting the electric load (in kilowatts) over time (in seconds) for operating 52-60 ton trains at 1-minute train intervals. The upper curve allows for a 10% increase for line loss, while the lower curve represents the motor input.
Key details on the chart include:
- The y-axis is labeled in kilowatts, ranging from 0 to 28,000 kW.
- The x-axis is labeled in seconds, extending from 0 to 120 seconds.
- The chart includes a dashed line indicating "Average Station Load" and another representing "Average of Motor Input."
- Additional load requirements are noted: "Additional Load which must be added for heating trains in cold weather: 30 KW per train, 52 trains = 1560 KW."
- The chart appears to have been prepared on May 26, 1899, as noted at the bottom along with the number "334R."
Overall, it is a technical document intended for planning and evaluating the electrical load requirements of the Boston Elevated Railway system circa 1899.
Anthropic Claude
Created by anthropic.claude-3-haiku-20240307-v1:0 on 2025-06-17
The image appears to be a graph or chart titled "Estimate of Station Load Curve for the Boston Elevated Railway Co." The graph shows the estimated station load curve for operating 52-80 ton trains at 1 minute train intervals. The graph includes various curves and annotations, such as the "Motor Input-Lower Curve", "Average Station Load", and "Average of Motor Input". The graph also provides additional information about the load requirements for heating trains in cold weather. Overall, the image appears to be a technical diagram or chart related to the operation and load management of a railway system.
Created by us.anthropic.claude-3-opus-20240229-v1:0 on 2025-06-17
The image shows a graph titled "ESTIMATE OF STATION LOAD CURVE FOR THE BOSTON ELEVATED RAILWAY CO." The graph plots time in seconds on the x-axis against load in kilowatts on the y-axis. There are several curves shown on the graph, including:
- Curve for operating 92-60 ton trains at 1 minute train intervals
- Motor Input-Lower curve
- Additional load which must be added for heating trains in cold weather, 32 KW per train
- Average Station Load
- Average of Motor Input
The graph provides an estimate of the station load curve for the Boston Elevated Railway Company in May 1939, allowing 10% for line loss. The upper curve shows the load for operating 92 trains weighing 60 tons each at 1 minute intervals.
Created by us.anthropic.claude-3-5-sonnet-20241022-v2:0 on 2025-06-17
This image shows a historical graph titled "ESTIMATE OF STATION LOAD CURVE FOR THE BOSTON ELEVATED RAILWAY CO." dated May 26, 1898. It's a black and white technical drawing plotted on grid paper showing power consumption over time.
The graph displays multiple curves:
- An upper curve showing station load "allowing 10% for line loss"
- A lower curve showing "Motor Input"
- Average station load and average motor input lines
The vertical axis shows power measurements from 0 to 28,000 (presumably kilowatts), while the horizontal axis shows time in seconds from 0 to about 120 seconds.
The graph notes that it's showing data for "operating 52-30 ton trains at 1 minute train intervals." There's also a note about additional load requirements for heating trains in cold weather, stating "50 KW per train, 32 trains = 1600 KW."
The curves show significant fluctuations in power consumption, with peaks reaching above 24,000 units and valleys dropping to around 8,000 units. This historical document provides interesting insight into early electric railway operations in Boston.
Meta Llama
Created by us.meta.llama3-2-11b-instruct-v1:0 on 2025-06-04
The image depicts a black-and-white graph titled "ESTIMATE OF STATION LOAD CURVE FOR THE BOSTON ELEVATED RAILWAY CO." The graph displays the estimated load curve for operating 52-80 ton trains at one-minute intervals. The x-axis represents time in seconds, ranging from 0 to 120 seconds, while the y-axis represents kilowatts, spanning from 0 to 28000.
The graph features two curves: the motor input-lower curve and the motor input-upper curve. Additionally, it includes notes on the average station load and the average motor input. The graph is dated May 26, 1933, and appears to be a hand-drawn or typed document.
Overall, the image presents a detailed analysis of the estimated load curve for the Boston Elevated Railway Company, providing valuable insights into the station's energy requirements.
Created by us.meta.llama3-2-90b-instruct-v1:0 on 2025-06-04
The image presents a black-and-white graph titled "ESTIMATE OF STATION LOAD CURVE FOR THE BOSTON ELEVATED RAILWAY CO." The graph displays the curve for operating 52-80 ton trains at 1-minute train intervals.
The x-axis represents time in seconds, ranging from 0 to 120 seconds, while the y-axis represents kilowatts, spanning from 0 to 28,000 kilowatts. The graph features two curves: the motor input-lower curve and the allowing 10% for line loss-upper curve. Additionally, it includes notes on average station load and average of motor input.
The graph is dated May 26, 1899, and appears to be a historical document related to the Boston Elevated Railway Company's operations.
Amazon Nova
Created by amazon.nova-lite-v1:0 on 2025-06-03
The image shows a graph titled "Estimate of Station Load Curve for the Boston Elevated Railway Co." The graph depicts the station load curve for the Boston Elevated Railway Co. The curve is plotted on a grid with two axes: the x-axis represents time in seconds, and the y-axis represents the station load in kilowatts (kW). The curve shows the average station load and the average motor input over time. The graph also includes annotations indicating the upper and lower curves, which represent the maximum and minimum station loads, respectively. The graph is dated May 26, 1939.
Created by amazon.nova-pro-v1:0 on 2025-06-03
The image is a black-and-white graph titled "Estimate of Station Load Curve for the Boston Elevated Railway Co." It is dated May 26, 1899, and includes a reference number 334E. The graph is plotted on a grid with time on the horizontal axis, marked in seconds, and load in kilowatts (kW) on the vertical axis, ranging from 0 to 28,000 kW.
The graph displays two distinct curves: the upper curve represents the station load, and the lower curve represents the motor input. The station load curve peaks significantly higher than the motor input curve, indicating the additional load that the station experiences.
Annotations on the graph provide additional context:
- "Curve for operating 52-80 ton trains of 1 minute train intervals" specifies the operational parameters.
- "Allowing 10% for line loss—Upper curve" explains the adjustment made for line losses.
- "Additional Load which must be added for heating trains in cold weather—30 kW per train" indicates an additional load requirement for heating during cold weather.
- "52 trains = 1560 kW" calculates the total additional load for 52 trains.
- "Average Station Load" and "Average of Motor Input" are noted to provide average values for the respective curves.
The graph is framed by a dark border and includes a small circular seal in the bottom right corner, possibly indicating official documentation or certification.
Google Gemini
Created by gemini-2.0-flash-lite on 2025-05-31
Here's a description of the image:
Overview
The image is a scanned document, likely a historical engineering or technical graph. It's a load curve analysis for the Boston Elevated Railway Company. The graph is hand-drawn on a grid, possibly a blueprint or technical drawing.
Content
- Title: "ESTIMATE OF STATION LOAD CURVE FOR THE BOSTON ELEVATED RAILWAY CO. Curve for operating 52-80 ton trains at 1 minute train intervals."
- X-axis: "Time in seconds"
- Y-axis: "Kilowatts" (representing electrical power)
- Curves:
- Two primary curves are visible, likely representing "Motor Input - Lower curve" and "Allowing 10% for line loss - Upper curve". This suggests the graph is tracking electrical power consumption over time, with one curve accounting for line losses.
- Additional Information:
- "Additional Load which must be added for heating trains in cold weather: - 30 K.W. per train 52 trains = 1560 K.W." This indicates a consideration for the extra power needed for train heating.
- "Average Station Load" and "Average of Motor Input" are marked on horizontal lines, likely representing average power consumption levels.
- Date: "May 26. 1899"
- Annotations: There are text annotations on the graph describing the data being displayed.
Style and Tone
- The image has a technical and analytical tone, consistent with engineering or scientific documentation.
- The handwriting style suggests it was created some time ago, likely during the early years of electrification of railways.
Overall Impression
The image presents a glimpse into the engineering practices of the late 19th or early 20th century, documenting how electrical load was analyzed for a railway system. It demonstrates the careful consideration of factors like line losses and seasonal demand in planning the power needs of trains.
Created by gemini-2.0-flash on 2025-05-31
Here's a description of the image:
The image is a scanned document displaying a graph titled "ESTIMATE OF STATION LOAD CURVE FOR THE BOSTON ELEVATED RAILWAY CO. Curve for operating 52-80 ton trains at 1 minute train intervals." The graph is presented on a grid, typical of technical diagrams. The x-axis, labeled "Time in seconds," ranges from 0 to 120. The y-axis, labeled "Kilowatts," ranges from 0 to 28,000.
Two jagged, fluctuating lines are plotted on the graph: "Motor Input - Lower Curve" and "Allowing 10% for line loss - Upper Curve." There are also two straight, horizontal lines indicating the "Average Station Load" and "Average of Motor Input."
Textual annotations are present on the graph, including: "Additional Load which must be added for heating trains in cold weather: 30 KW per train 52 trains = 1560 KW." The document is dated "May 26, 1899." and marked "334E".
Mistral Pixtral
Created by us.mistral.pixtral-large-2502-v1:0 on 2025-06-04
The image is a graph titled "ESTIMATE OF STATION LOAD CURVE FOR THE BOSTON ELEVATED RAILWAY CO." It shows the estimated station load curve for trains operating at 52-80 ton capacity with 1-minute intervals between trains. The graph includes two main curves:
- Upper Curve: This represents the station load allowing for a 10% line loss.
- Lower Curve: This represents the motor input.
The y-axis of the graph is labeled in kilowatts (KW), ranging from 0 to 28,000 KW. The x-axis is labeled "Time in Seconds," ranging from 0 to 160 seconds.
Key points on the graph:
- The upper curve fluctuates between approximately 16,000 KW and 26,000 KW.
- The lower curve fluctuates between approximately 10,000 KW and 20,000 KW.
- There is a horizontal line labeled "Average Station Load" at around 18,000 KW.
- Another horizontal line labeled "Average of Motor Input" is slightly below the "Average Station Load" line.
Additional information provided on the graph:
- An additional load of 30 KW per train is required for heating trains in cold weather.
- For 32 trains, this additional load amounts to 1,560 KW.
The graph is dated May 30, 1933, indicating that this data or estimate was prepared on that date.
Qwen
Created by Qwen/Qwen2.5-VL-7B-Instruct on 2025-07-05
The image is a black-and-white graph titled "Estimate of Station Load Curve for the Boston Elevated Railway Co." It is designed to show the load curve for operating 52-80 ton trains at 1-minute train intervals. The graph includes two curves:
- Motor Input - Lower curve: This represents the motor input required for the trains.
- Allowing 10% for line loss - Upper curve: This curve takes into account a 10% line loss and provides an upper estimate of the load.
The graph also includes annotations for the additional load that must be added for heating trains in cold weather:
- 30 K.W. per train.
- 52 trains = 1560 K.W. (total additional load).
The graph provides a visual representation of how the load varies with time, measured in seconds. There are horizontal and vertical lines that indicate the average station load and the average motor input. The date "May 26, 1899" is stamped at the bottom of the graph. The image appears to be a historical document, likely used for planning or engineering purposes related to the Boston Elevated Railway system.
Created by Qwen/Qwen2.5-VL-72B-Instruct on 2025-07-05
This image is a graph titled "ESTIMATE OF STATION LOAD CURVE FOR THE BOSTON ELEVATED RAILWAY CO." It depicts the electrical load curve for operating 52-80 ton trains at 1-minute intervals. The graph is plotted on a grid with the vertical axis labeled "Kilowatts" and the horizontal axis labeled "Time in Seconds."
The graph shows two main curves:
- The upper curve, which allows for a 10% line loss, represents the total estimated load.
- The lower curve represents the motor input.
There is also a note indicating that an additional load of 30 KW per train must be added for heating trains in cold weather, which totals 1560 KW for 52 trains.
The graph also shows the average station load and the average motor input. The date "May 26, 1895" is written at the bottom of the graph.
Text analysis
Amazon